แผนภูมิความดันโลหิตปกติ
เรียนรู้ช่วงความดันโลหิตปกติด้วยแผนภูมิความดันโลหิตปกติของเราเรียนรู้ที่จะตีความการอ่านและรักษาสุขภาพหัวใจอย่างมีประสิทธิภาพ

Fact Checked by เอริกก้า ปิงกอล.


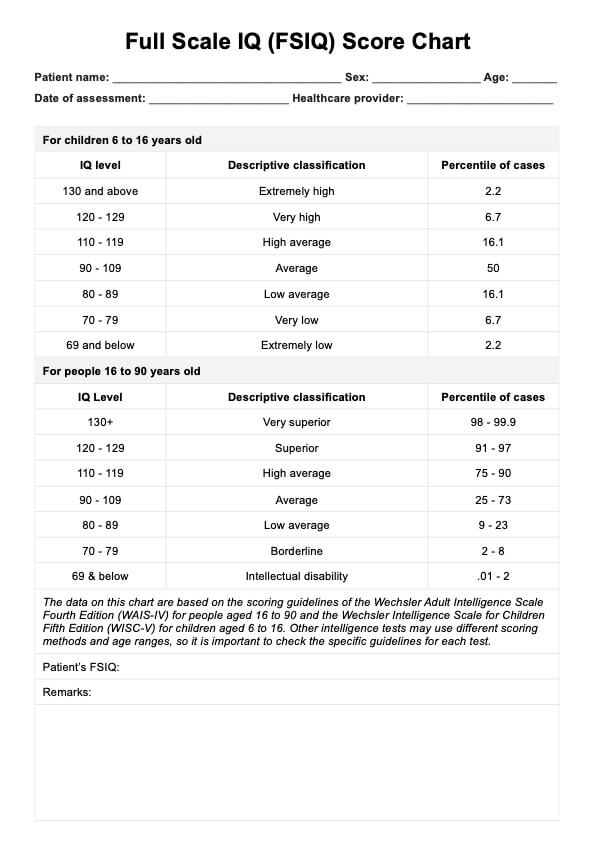
แผนภูมิความดันโลหิตปกติคืออะไร?
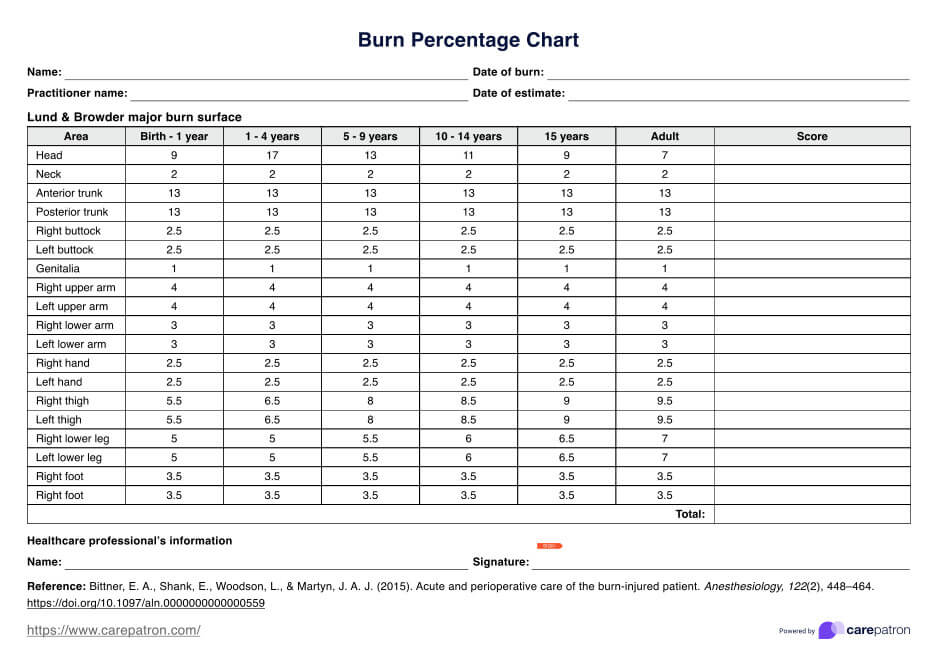
มาตรฐาน แผนภูมิความดันโลหิต แสดงค่าความดันโลหิตที่ได้จากการวัดที่ทำระหว่างการตรวจสุขภาพของบุคคลหรือการทดสอบที่บ้านวัดความดันโลหิตโดยใช้เครื่องวัดสฟีกโมมาโนมิเตอร์วัดเป็นมิลลิเมตรของปรอท (mmHg) และแสดงเป็นความดันซิสโตลิกเหนือความดันโลหิตไดแอสโตลิก
ค่าเริ่มต้น ความดันโลหิตซิสโตลิก หมายถึงระดับสูงสุดที่บรรลุเมื่อหัวใจเต้นโดยขับเลือดเข้ากับผนังหลอดเลือดแดงค่าที่สองคือความดันไดแอสโตลิกบ่งบอกถึงระดับต่ำสุดเนื่องจากหัวใจพักระหว่างการเต้นการแสดงความดันโลหิตมาตรฐานอยู่ในรูปแบบซิสโตลิกมากกว่าไดแอสโตลิก
แผนภูมิความดันโลหิตปกติสามารถใช้เป็นพื้นฐานสำหรับผู้เชี่ยวชาญด้านการดูแลสุขภาพเพื่อประเมินการอ่านความดันโลหิตของแต่ละบุคคลและตรวจสอบว่าอยู่ในช่วงที่มีสุขภาพดีหรือไม่แผนภูมินี้รวมถึงการอ่านความดันโลหิตซิสโตลิกและไดแอสโตลิกซึ่งวัดเป็นมิลลิเมตรของปรอท (mmHg)
การอ่านความดันโลหิตที่ดีต่อสุขภาพอยู่ที่ประมาณ 120/80 mmHg (ศูนย์ควบคุมและป้องกันโรค, 2021)นั่นคือความดันโลหิตในอุดมคติอย่างไรก็ตามค่าเฉลี่ยนี้ได้รับอิทธิพลจากอายุและสถานะสุขภาพปัจจุบันของผู้ป่วย โดยเน้นความจำเป็นที่ผู้เชี่ยวชาญด้านการดูแลสุขภาพจะต้องพิจารณาปัจจัยต่าง ๆ เมื่อตีความผลลัพธ์และระดับความดันโลหิต เนื่องจากสิ่งที่อาจถือว่าเป็นเรื่องปกติสำหรับบุคคลหนึ่งอาจเป็นปัญหาสำหรับคนอื่น
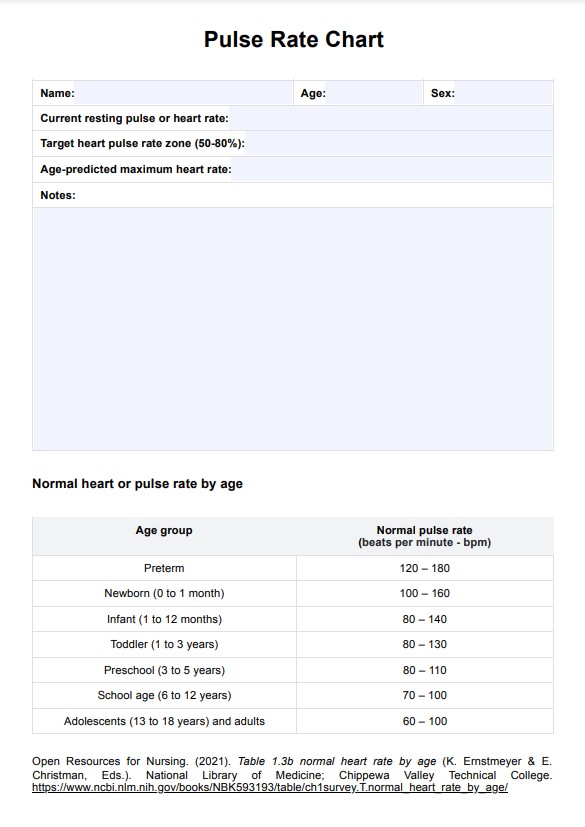
อัตราชีพจรและความดันโลหิตเหมือนกันหรือไม่
บางคนอาจสับสนอัตราชีพจรกับความดันโลหิตเนื่องจากมีความสัมพันธ์อย่างใกล้ชิดกับสุขภาพหัวใจและหลอดเลือดอย่างไรก็ตามพวกเขาไม่ใช่อัตราชีพจรหรืออัตราการเต้นของหัวใจหมายถึงจำนวนครั้งที่หัวใจเต้นต่อนาทีอัตราการเต้นของหัวใจพักโดยปกติจะอยู่ในช่วง 60 ถึง 100 ครั้งต่อนาที แต่อาจผันผวนในช่วงเวลาสั้น ๆ (British Heart Foundation, 2021)ในทางกลับกันความดันโลหิตจะวัดแรงของเลือดกับผนังหลอดเลือดแดง
ก แผนภูมิอัตราชีพจร แสดงการเต้นของหัวใจเมื่อเวลาผ่านไปทำให้การสังเกตแนวโน้มและรูปแบบที่ผิดปกติง่ายขึ้นเป็นเครื่องมือที่มีประโยชน์ในการติดตามสุขภาพหัวใจและดูว่าการรักษาหรือการเปลี่ยนแปลงวิถีชีวิตทำงานได้ดีเพียงใด
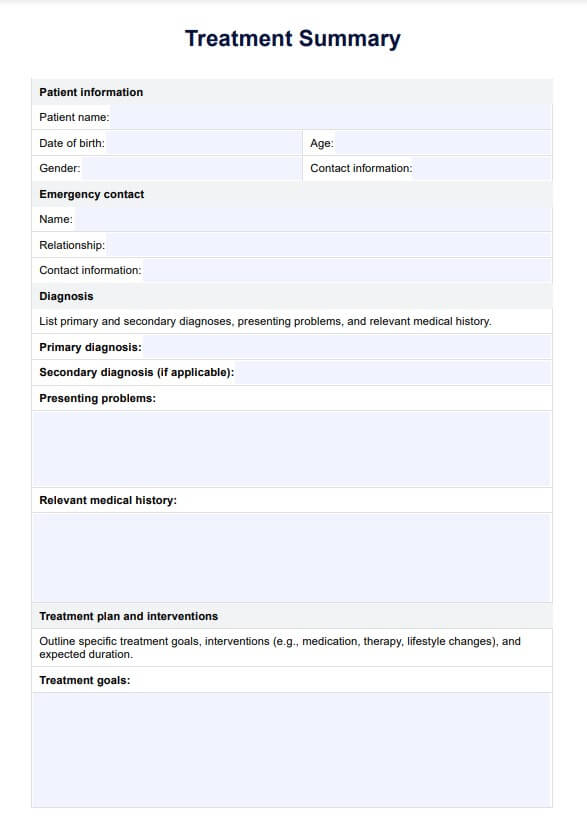
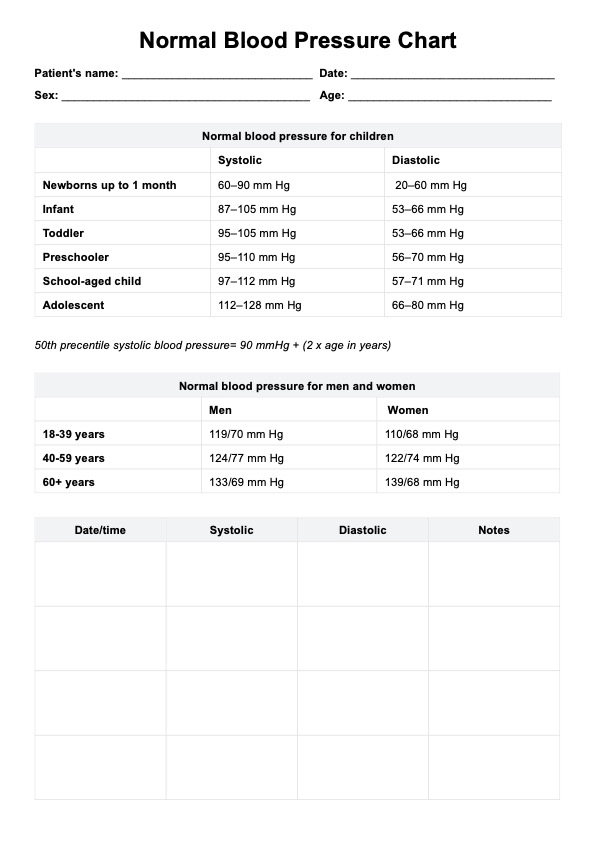
เทมเพลตแผนภูมิความดันโลหิตปกติ
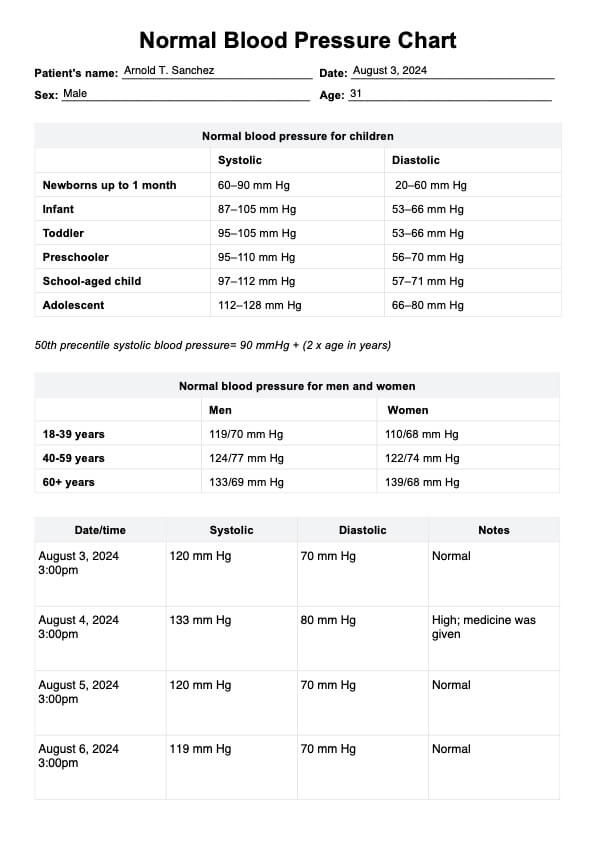
ตัวอย่างแผนภูมิความดันโลหิตปกติ
ทำความเข้าใจเลือดต่ำและความดันโลหิตสูง
การทำความเข้าใจความดันโลหิตต่ำและสูงเป็นสิ่งจำเป็นสำหรับการรักษาสุขภาพโดยรวมช่วยรับรู้ความเสี่ยงที่อาจเกิดขึ้นและใช้มาตรการที่เหมาะสมเพื่อจัดการอย่างมีประสิทธิภาพนี่คือสิ่งพื้นฐานบางประการที่ต้องรู้เกี่ยวกับแต่ละอย่าง
ความดันโลหิตต่ำ
ความดันโลหิตต่ำหรือความดันเลือดต่ำเกิดขึ้นเมื่อเลือดไหลผ่านหลอดเลือดที่ความดันต่ำกว่าช่วงปกติ โดยปกติจะต่ำกว่า 90/60 mm Hgภาวะนี้มีความเสี่ยงสูงขึ้นสำหรับอาการเช่นร่วงหรือเป็นลมโดยเฉพาะในผู้สูงอายุสาเหตุ ได้แก่ การสูญเสียเลือดจากการบาดเจ็บ การขาดน้ำ โรคเบาหวาน ปัญหาหัวใจ เช่น หัวใจเต้นผิดปกติ ยาสำหรับภาวะต่างๆ เช่น ความดันโลหิตสูงหรือภาวะซึมเศร้า และการตั้งครรภ์ (National Heart, Lung, and Blood Institute, 2022)
นี่คืออาการบางอย่างที่ควรระวัง (Penn Medicine, 2019; สถาบันหัวใจ ปอด และเลือด แห่งชาติ, 2022):
- อาการวิงเวียน
- เป็นลม
- ความสับสน
- ความอ่อนแอ
- การมองเห็นเบลอ
- คลื่นไส้
- หัวใจสั่น
ความดันโลหิตสูง
ความดันโลหิตสูงหรือความดันโลหิตสูงเป็นภาวะที่พบบ่อย แต่อาจรุนแรงโดยมีความดันสูงในหลอดเลือด (140/90 mmHg หรือสูงกว่า) ซึ่งมักไม่มีอาการที่เห็นได้ชัด (องค์การอนามัยโลก, 2023)
ผู้ที่มีความดันโลหิตสูงมากอาจมีอาการต่อไปนี้:
- ปวดศีรษะรุนแรง
- รู้สึกไม่สบายหน้าอก
- รู้สึกหงุดหงิด
- หายใจลำบาก
- คลื่นไส้หรืออาเจียน
- การเปลี่ยนแปลงในการมองเห็น
- ความสับสนทางจิต
- หัวใจเต้นผิดปกติ
ขั้นตอนความดันโลหิตสูง
ความดันโลหิตแบ่งออกเป็นห้าประเภทที่ช่วยแยกแยะความรุนแรงของความเสี่ยงที่อาจเกิดขึ้นที่เกี่ยวข้องกับความดันโลหิตที่เพิ่มขึ้นนี่คือห้าขั้นตอนของความดันโลหิตสูง (สมาคมหัวใจอเมริกัน, 2023):
- ช่วง BP ปกติ: การอ่านความดันโลหิตต่ำกว่า 120/80 mm Hg เป็นเรื่องปกติ
- ยกระดับ: ความดันโลหิตตั้งแต่ 120-129 ซิสโตลิกและไดแอสโตลิกน้อยกว่า 80 สูงขึ้นหากไม่มีการแทรกแซงมีความเสี่ยงที่จะก้าวไปสู่ความดันโลหิตสูง
- ความดันโลหิตสูงขั้นที่ 1: การวัดความดันโลหิตอย่างสม่ำเสมอตั้งแต่ 130 ถึง 139 ซิสโตลิก หรือ 80 ถึง 89 mm Hg ไดแอสโตลิก ทำให้ผู้ป่วยอยู่ในความดันโลหิตสูงระยะที่ 1โดยทั่วไปแนะนำให้ใช้ยาความดันโลหิตและการเปลี่ยนแปลงวิถีชีวิตตามความเสี่ยงของผู้ป่วยของโรคหลอดเลือดหัวใจและหลอดเลือดหัวใจเพื่อลดความดันโลหิต
- ความดันโลหิตสูงระยะที่ 2: มันเกิดขึ้นเมื่อความดันโลหิตอ่านอย่างสม่ำเสมอ 140/90 mm Hg หรือสูงกว่าในขั้นตอนนี้ผู้เชี่ยวชาญด้านการดูแลสุขภาพได้รับการสนับสนุนอย่างยิ่งให้สั่งยาความดันโลหิตและการเปลี่ยนแปลงวิถีชีวิต
- วิกฤตความดันโลหิตสูง หากความดันโลหิตสูงกว่า 180/120 mm Hg มันเป็นวิกฤตที่ต้องได้รับการดูแลทางการแพทย์ทันทีทำซ้ำการทดสอบหลังจากห้านาที ปรึกษาผู้เชี่ยวชาญด้านการดูแลสุขภาพหากค่าสูงยังคงอยู่
หากผู้ป่วยแสดงอาการเจ็บหน้าอกปวดหลังหายใจถี่ชาอ่อนเพลียการเปลี่ยนแปลงการมองเห็นหรือลำบากในการพูดจะบ่งบอกถึงความเสียหายของอวัยวะเมื่อความดันโลหิตเกิน 180/120 mm Hg ควบคู่ไปกับอาการเหล่านี้จำเป็นต้องให้ความช่วยเหลือทางการแพทย์ทันที
แผนภูมิความดันโลหิตปกติของเราทำงานอย่างไร
ปกติ การตรวจสอบความดันโลหิต มีความสำคัญต่อการประเมินสุขภาพหัวใจและหลอดเลือดและป้องกันภาวะแทรกซ้อนที่เกี่ยวข้องกับความดันโลหิตสูงในการเริ่มต้นด้วยการช่วยผู้ป่วยรักษาภาวะปกติหรือรักษาความดันโลหิตสูง ให้ทำตามขั้นตอนเหล่านี้:
ขั้นตอนที่ 1: ดาวน์โหลดแผนภูมิความดันโลหิตปกติ
แผนภูมิความดันโลหิตปกติเป็นแหล่งข้อมูลอันล้ำค่าที่ควรเก็บไว้ในมือคุณสามารถติดตามและใช้ทรัพยากรนี้ได้อย่างง่ายดายโดยคลิกลิงก์ดาวน์โหลดในหน้านี้คุณยังสามารถตรวจสอบตัวอย่างแผนภูมิความดันโลหิตปกติที่กรอกแล้วของเราเพื่ออ้างอิงว่าควรมีลักษณะอย่างไรโปรดทราบว่านี่เป็นแผนภูมิความดันโลหิตที่พิมพ์ได้เช่นกัน
ขั้นตอนที่ 2: รวบรวมข้อมูลสำคัญจากผู้ป่วยของคุณ
กรอกข้อมูลผู้ป่วยที่จำเป็นทั้งหมดควรระบุปัจจัยอายุและวิถีชีวิตเช่นการสูบบุหรี่และการออกกำลังกาย
หลังจากทำการทดสอบความดันโลหิตให้วิเคราะห์ความดันซิสโตลิกเหนือความดันไดแอสโตลิกตามพารามิเตอร์ที่แนะนำเพื่อกำหนดค่าของผู้ป่วยและหากมีการเปลี่ยนแปลงหรือจำเป็นต้องแทรกแซง
ขั้นตอนที่ 3: รักษาความปลอดภัยและจัดเก็บแผนภูมิที่กรอกแล้ว
เมื่อตรวจสอบผลลัพธ์แล้วให้รักษาแผนภูมิความดันโลหิตปกติเพื่อให้สามารถเข้าถึงได้เฉพาะบุคคลที่เกี่ยวข้องเท่านั้นเนื่องจากความดันโลหิตเป็นผลลัพธ์ที่บันทึกไว้ทั่วไป แพทย์และผู้ป่วยจึงจำเป็นต้องเข้าถึงแผนภูมิความดันโลหิตได้อย่างง่ายดาย
คุณจะใช้แผนภูมินี้เมื่อใด
แผนภูมิความดันโลหิตปกติเป็นเครื่องมือที่ใช้ประโยชน์อย่างดีที่ใช้ในสถานพยาบาลที่หลากหลายโดยทั้งผู้ปฏิบัติงานแพทย์และผู้ป่วยด้วยเหตุผลหลายประการ ซึ่งบางส่วนมีการระบุไว้ด้านล่าง:
การตรวจสุขภาพและการตรวจสอบผู้ป่วย
ผู้เชี่ยวชาญทางการแพทย์อาจใช้แผนภูมิความดันโลหิตในระหว่างการตรวจคัดกรองและการตรวจร่างกายเป็นประจำเพื่อประเมินสุขภาพหัวใจและหลอดเลือดของแต่ละบุคคล นอกจากนี้ยังสามารถใช้ในระหว่างการตรวจสุขภาพเป็นประจำเพื่อตรวจสอบการเปลี่ยนแปลงที่สำคัญในความดันโลหิตของผู้ป่วย
การดูแลป้องกัน
การสร้างแผนภูมิอย่างต่อเนื่องและสม่ำเสมอของการวัดความดันโลหิตของแต่ละบุคคลเป็นมาตรการป้องกันที่ยอดเยี่ยมเพื่อช่วยระบุความจำเป็นในการเปลี่ยนแปลงก่อนที่สภาวะที่คุกคามชีวิตเช่นโรคหัวใจหรือโรคหลอดเลือดสมองกลายเป็นจริง
การวินิจฉัยและการรักษา
แผนภูมิความดันโลหิตมีความสำคัญในการวินิจฉัยและจัดการสภาวะเช่นความดันโลหิตสูงพวกเขาสามารถช่วยกำหนดแผนการรักษาที่เหมาะสมและผู้เชี่ยวชาญทางการแพทย์สามารถบันทึกและเข้าถึงการวัดเพื่อตรวจสอบประสิทธิภาพของการแทรกแซงที่กำหนด
การวิจัย
การวัดความดันโลหิตถูกนำมาใช้เป็นอย่างดีในการศึกษาทางคลินิกเพื่อวิเคราะห์และทำนายแนวโน้มของระดับความดันโลหิตในประชากรต่างๆข้อมูลนี้มีค่าอย่างล้ำค่าในการระบุกลุ่มปัจจัยเสี่ยงและช่วยกำหนดว่าใครควรได้รับการทดสอบความดันโลหิตเป็นประจำเพื่อลดความเสี่ยงของความดันโลหิตสูง
การออกกำลังกายและความเป็นอยู่ที่ดี
โปรแกรมความเป็นอยู่ที่ดีและการออกกำลังกายอาจใช้แผนภูมิความดันโลหิตเพื่อตรวจสอบผลกระทบของการเปลี่ยนแปลงอาหารและการดำเนินชีวิตเฉพาะต่อสุขภาพหัวใจและหลอดเลือดการรวมสิ่งนี้ เทมเพลตการทดสอบความดันโลหิต และ เทมเพลตใบสั่งยา สามารถเสริมสร้างความสำเร็จในการปฏิบัติและความสำเร็จของลูกค้า
การอ้างอิง
สมาคมหัวใจอเมริกัน (2023, 30 พฤษภาคม). ทำความเข้าใจการอ่านความดันโลหิต.สมาคมหัวใจอเมริกัน https://www.heart.org/en/health-topics/high-blood-pressure/understanding-blood-pressure-readings
มูลนิธิหัวใจอังกฤษ (2021, 27 พฤษภาคม). อัตราชีพจรปกติคืออะไร? https://www.bhf.org.uk/informationsupport/heart-matters-magazine/medical/ask-the-experts/pulse-rate
ศูนย์ควบคุมและป้องกันโรค (2021, 18 พฤษภาคม) อาการความดันโลหิตสูงและสาเหตุ. https://www.cdc.gov/bloodpressure/about.htm
สถาบันหัวใจ ปอด และเลือดแห่งชาติ (2022, 24 มีนาคม). ความดันโลหิตต่ำ. https://www.nhlbi.nih.gov/health/low-blood-pressure
(2019). ความดันโลหิตต่ำ. https://www.pennmedicine.org/for-patients-and-visitors/patient-information/conditions-treated-a-to-z/low-blood-pressure
(2023, 16) ความดันโลหิตสูง. https://www.who.int/news-room/fact-sheets/detail/hypertension
คำถามที่พบบ่อย
ผู้เชี่ยวชาญด้านการดูแลสุขภาพเช่นแพทย์มักขอแผนภูมิความดันโลหิตเพื่อติดตามและวินิจฉัยปัญหาสุขภาพหัวใจและหลอดเลือด
ใช้ในบริบทต่างๆเพื่อตรวจสอบและประเมินช่วงและระดับความดันโลหิตทั้งผู้ปฏิบัติงานและผู้ป่วยสามารถใช้ประโยชน์ได้
เป็นเครื่องมือสำหรับการติดตามและตีความการอ่านความดันโลหิตที่รวบรวมผ่านเครื่องวัดความดันโลหิตหรือเครื่องวัดความดันโลหิตอัตโนมัติเมื่อเวลาผ่านไป
การวัดเพียงครั้งเดียวใช้เวลาไม่กี่นาทีในการทำเสร็จสิ้น และการบันทึกลงในแผนภูมิความดันโลหิตใช้เวลาประมาณหนึ่งนาที
แม่แบบที่เกี่ยวข้อง

เทมเพลตยอดนิยม