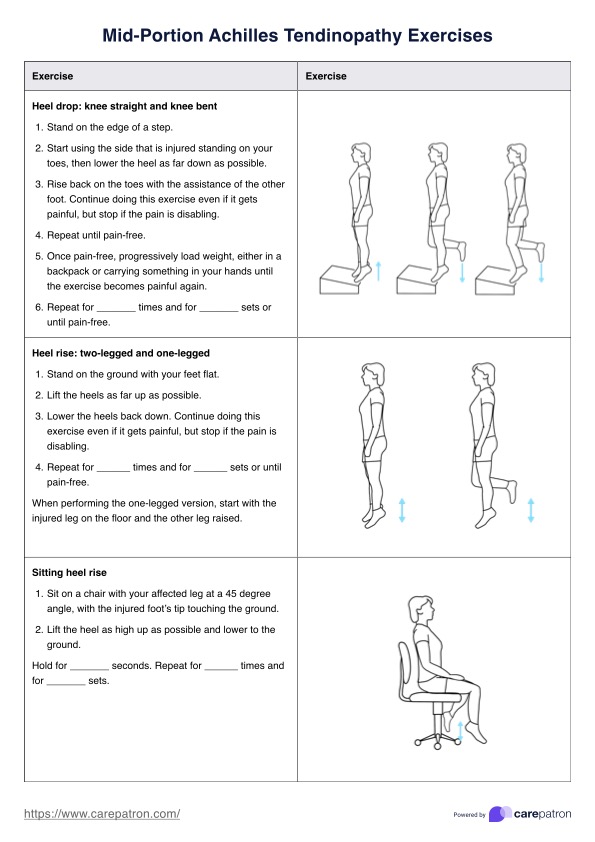
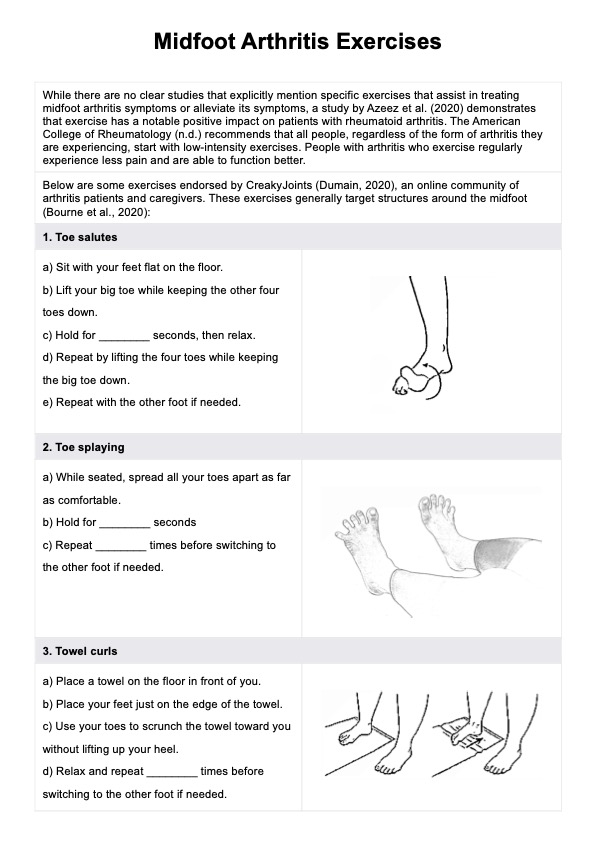
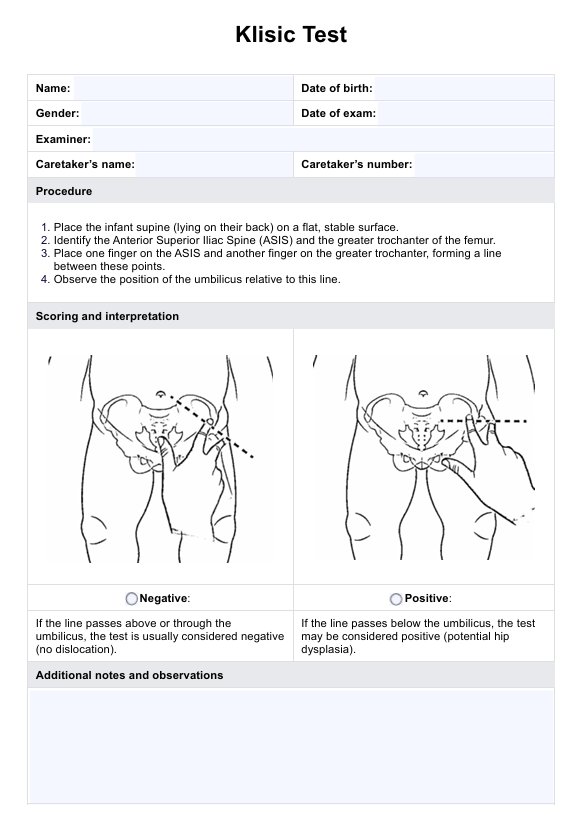
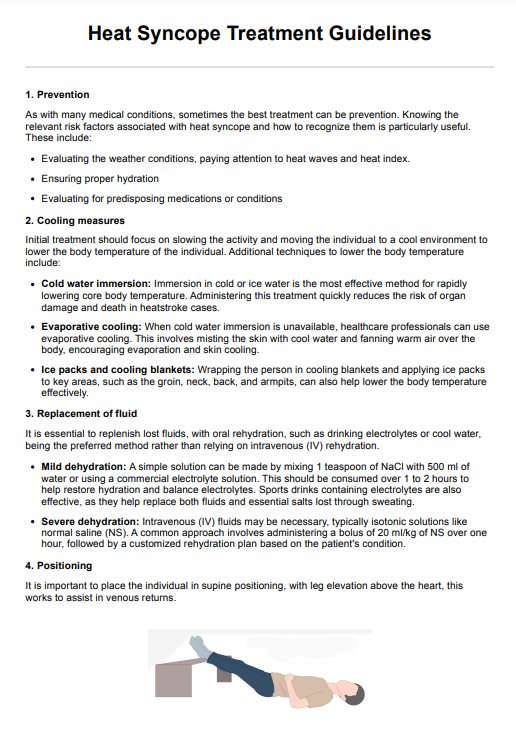
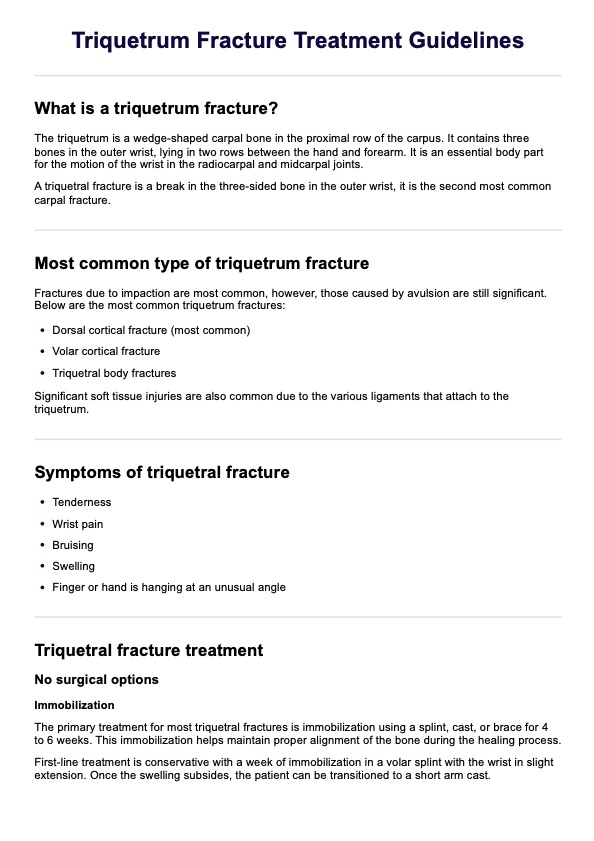
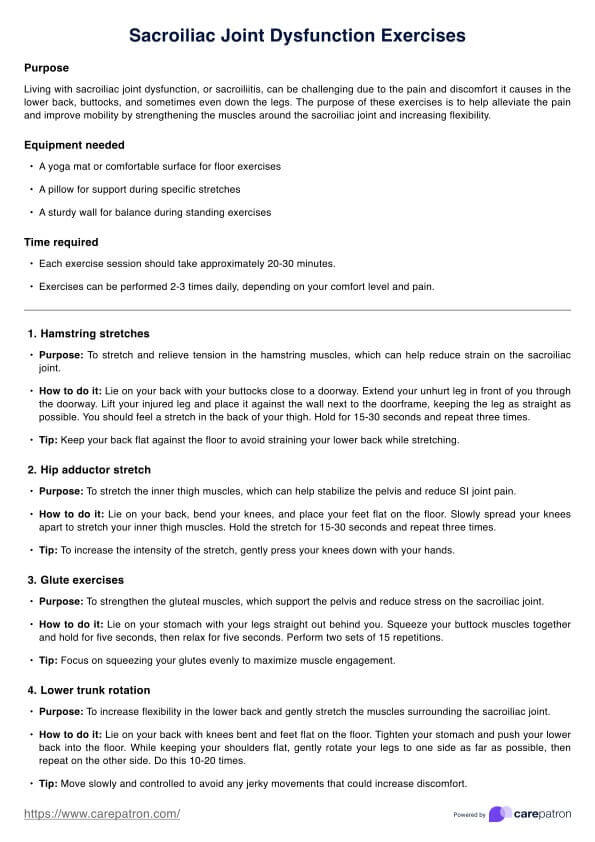
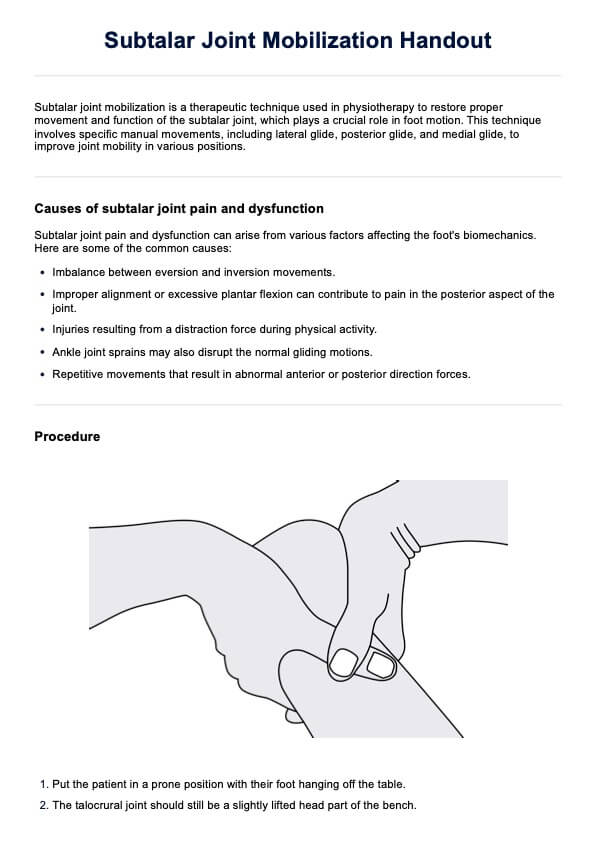
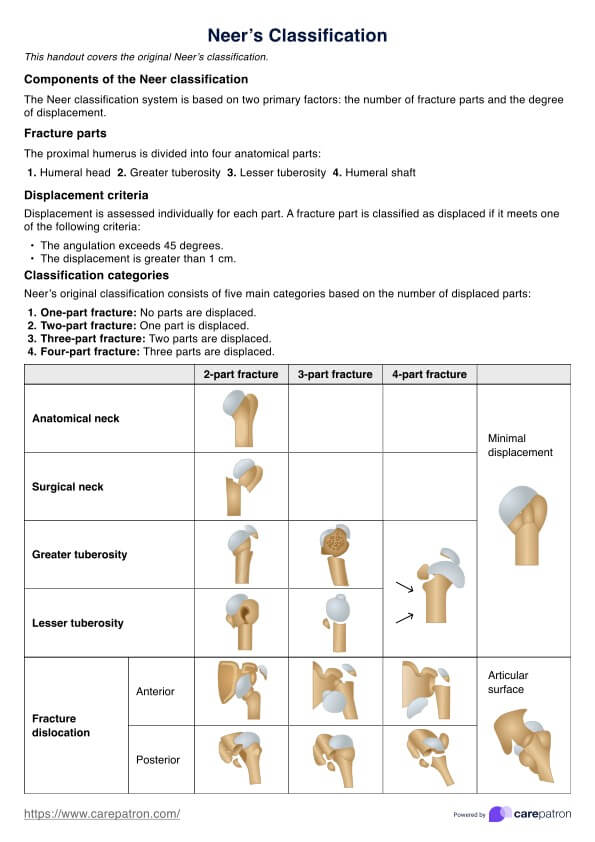
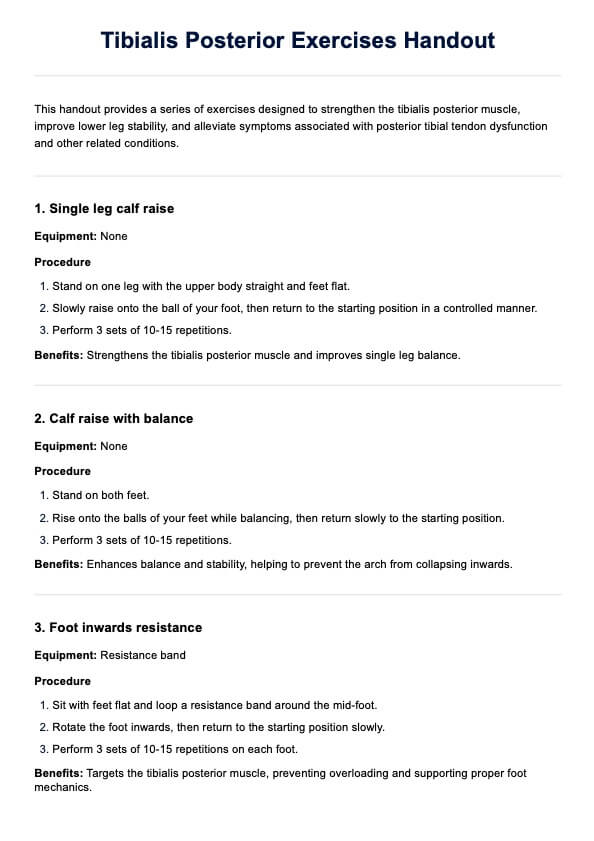
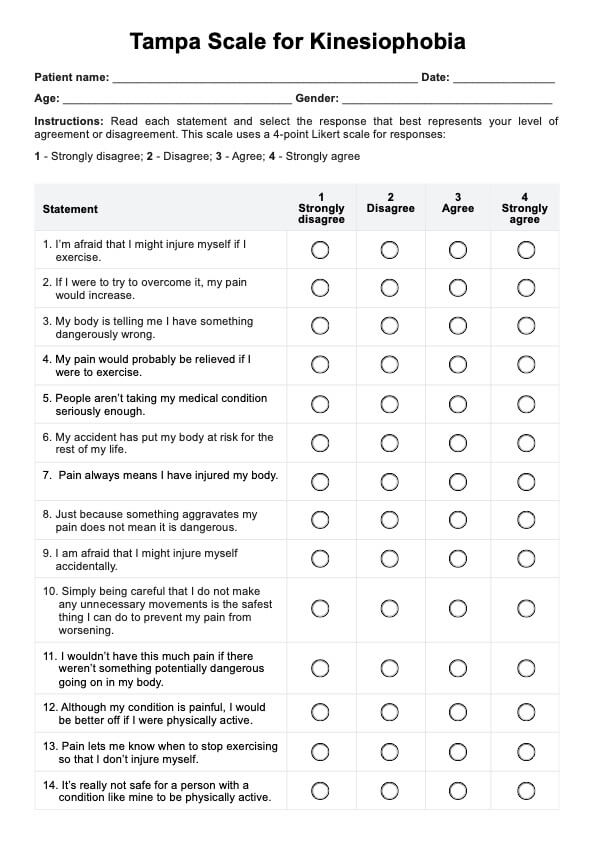
Pain Level Chart
Use the Pain Level Chart to understand patients' experience of pain and its impact on their functioning and well-being.

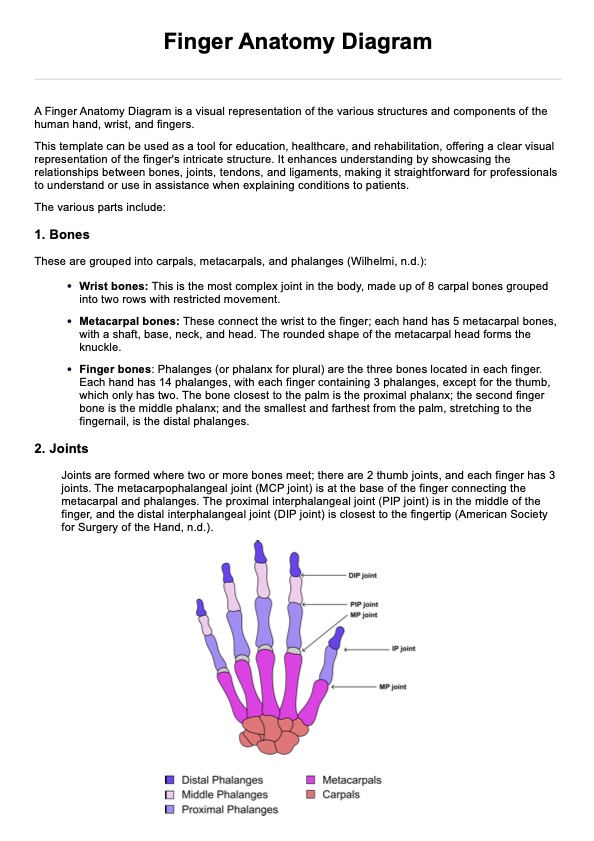
Fact Checked by Nate Lacson.


Measuring pain intensity
Pain intensity refers to the severity or magnitude of the pain experienced. This helps healthcare professionals determine the appropriate course of treatment and monitor the effectiveness of interventions. Pain intensity can range from mild to severe, significantly impacting a person's quality of life, physical activity, and overall well-being (Dansie & Turk, 2013).
Healthcare practitioners have several tools and scales at their disposal to measure and document a person's pain experience effectively. Here's an overview of some commonly used methods for measuring pain severity and intensity:
- McGill Pain Questionnaire (MPQ): While pain intensity is a crucial aspect of pain assessment, it is essential to recognize that pain is a multidimensional experience. Multidimensional pain scales, such as the MPQ, provide a more comprehensive evaluation by considering pain intensity, quality, and emotional aspects (Melzack, 1975).
- Numerical rating scale (NRS): Numerical pain scalestypically range from 0 (no pain) to 10 (worst possible pain). Patients are asked to rate their pain intensity by choosing a number that best represents their current pain on a scale (Hjermstad et al., 2011).
- Visual analog scale (VAS): This pain inventory consists of a horizontal or vertical line, usually 10 centimeters long, with anchors at each end representing "no pain" and "worst possible pain." Patients are instructed to mark a point on the line corresponding to their perceived pain intensity (Hjermstad et al., 2011).
- Veterans pain rating scale: Developed by the Department of Veterans Affairs, this scale combines numerical ratings with descriptive words and facial expressions. Patients rate their pain intensity on a scale from 0 (no pain) to 10 (worst possible pain), with accompanying word descriptors and facial expressions to aid in selecting the appropriate rating (Polomano et al., 2016).
- Verbal rating scale (VRS): This scale uses descriptive words such as "no pain," "mild pain," "moderate pain," "severe pain," and "worst possible pain" to represent different levels of pain intensity (Hjermstad et al., 2011).
- Wong-Baker FACES pain rating scale: This scale is handy for assessing pain in children or individuals with cognitive impairments. It features six faces, ranging from a smiling face (no pain) to a crying face (the worst possible pain).
Pain Level Chart Template
Pain Level Chart Example
What is a Pain Level Chart?
Pain Level Charts, or pain scales, are essential tools that the medical community uses to quantify and understand a person's pain intensity and severity. This assessment tool provides a standardized method for measuring pain. In doing so, these charts facilitate better communication between patients and healthcare providers.
Pain level charts are especially useful for individuals with chronic pain conditions. Since these individuals experience pain on an ongoing basis, it is crucial to have a consistent and objective way of measuring their pain levels. Pain level charts can also be used by individuals who may not be able to verbally communicate their pain, such as young children or adults with cognitive impairments.
How does this printable Pain Level Chart work?
A Printable Pain Level Chart is a useful tool for helping individuals and healthcare professionals assess, communicate, and monitor pain intensity.
Step 1: Download the Pain Level Chart template
Download our free PDF template to start using the Pain Level Chart. It's accessible via the Carepatron app and on our Resource Library.
Use the Abbey Pain Scale Template to effectively assess and document pain levels in patients, especially those who may have difficulty communicating their discomfort. Additionally, the Relaxation Techniques Template offers strategies for managing and alleviating stress and discomfort, making it a valuable resource for patient care and recovery.
Step 2: Understand the pain scale
Familiarize your client or patient with the pain scale, which ranges from 0 (no pain) to 10 (worst possible pain). Each level describes the pain intensity and associated symptoms or conditions.
Step 3: Let them assess pain
Allow the patient some time to assess the intensity of their own pain and describe which level on the chart best describes their experience.
Step 4: Discuss the pain level and related strategies
Discuss the level of pain and the details with the patient to understand their discomfort and provide appropriate support or treatment.
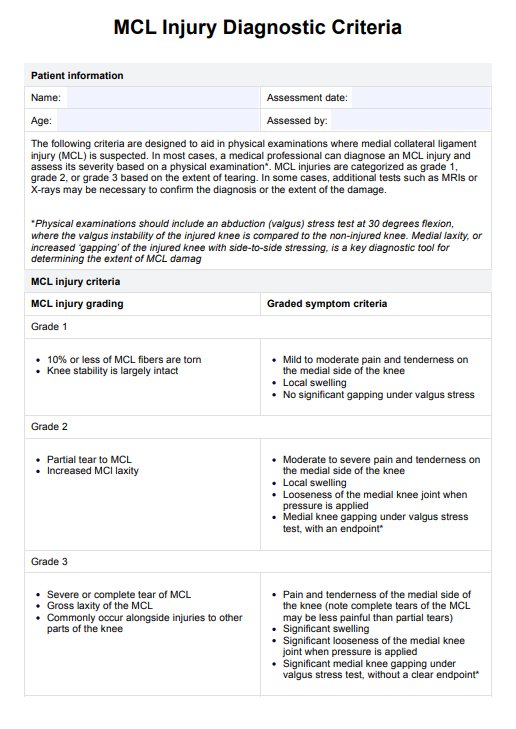
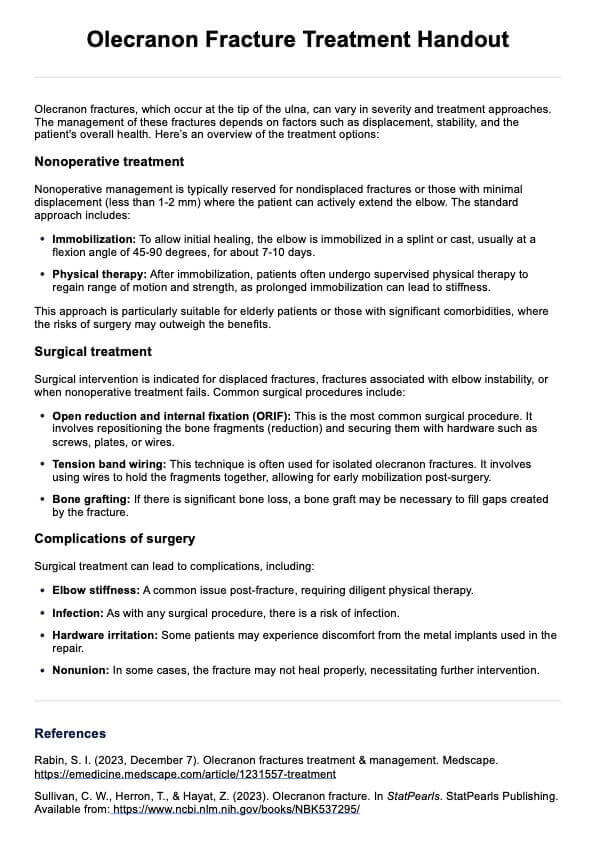
Scoring and interpretation
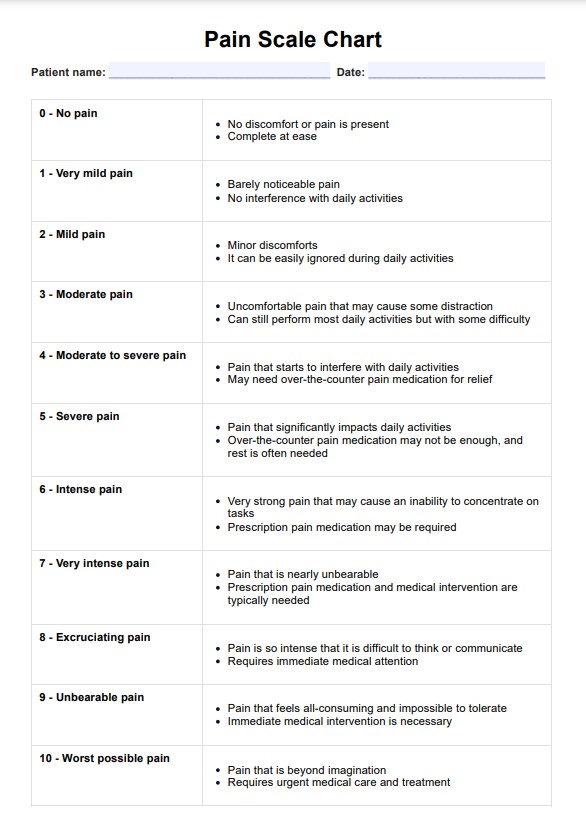
The numerical scale system used in our Pain Level Chart provides a standardized method for assessing pain intensity. This is helpful, especially in determining how pain affects a person's life. Here's an overview of how to interpret the scores on a simple scale through our Pain Level Chart:
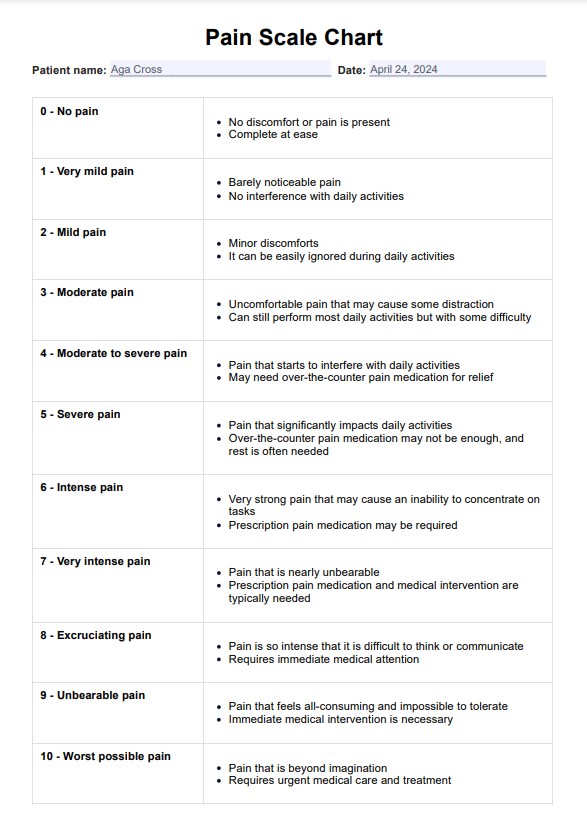
- No pain (Score: 0): A score of 0 indicates the absence of pain or discomfort. The person is entirely at ease and experiences no pain whatsoever.
- Very mild pain (Score: 1-2): Scores in this range represent mild pain levels. At a score of 1, the pain is barely noticeable and does not interfere with the ability to function. A score of 2 indicates minor discomfort that can be easily ignored during usual activities.
- Mild pain (Score: 3-4): Mild pain scores suggest the presence of discomfort or pain that may cause some distraction. At a score of 3, the pain is considered moderate but does not significantly impact daily activities. A score of 4 indicates pain that starts interfering with daily activities, and over-the-counter pain medications may be needed for relief.
- Moderate to severe pain (Score: 5-6): Higher scores in this range represent moderate to severe pain levels. A score of 5 indicates uncomfortable pain that can still be managed with some difficulty during daily activities. At a score of 6, the pain significantly impacts daily activities, and over-the-counter pain medicine may not provide sufficient relief.
- Severe pain (Score: 7-8): A score of 7 suggests very intense pain that may cause an inability to concentrate on tasks, and prescription pain medication may be required. At a score of 8, the pain is described as excruciating and nearly unbearable, typically requiring prescription pain medication and medical intervention.
- Worst pain (Score: 9-10): Scores of 9 or 10 represent the most extreme pain levels. A score of 9 indicates unbearable pain that is difficult to think or communicate through, necessitating immediate medical attention. At a score of 10, the pain is described as the worst possible pain imaginable, requiring urgent medical care and treatment.
While pain level charts provide a standardized framework for assessing pain intensity, doctors and other healthcare providers should consider different factors. These include the individual's pain history, underlying medical conditions, and overall functional status in their daily life.
What are the different types of pain?
Pain is a complex and subjective experience. This makes it challenging to assess and manage effectively. When discussing pain, it's essential to understand that there are different types of pain that individuals can experience, from mild to extreme pain.
Recognizing the several types of pain is crucial for healthcare practitioners to provide appropriate assessment and management strategies.
Acute pain
Acute pain is a sudden and typically short-lived form of pain that is a warning signal for an underlying injury or illness. It can range from mild to severe and often results from trauma, surgery, or an acute medical condition. Acute pain resolves once the underlying cause is addressed or the body heals.
Chronic pain
Unlike acute pain, chronic pain persists for an extended period, typically lasting over three to six months. It can be continuous or intermittent and may continue even after the initial injury or illness has healed. Chronic pain conditions can be challenging to manage and may involve various underlying mechanisms, such as inflammation, nerve damage, or changes in the central nervous system (Treede et al., 2015). A Chronic Pain Grade Scale can help assess chronic pain and its impact, especially among chronic pain patients.
Nociceptive pain
Nociceptive pain is caused by activating specialized nerve endings called nociceptors in response to actual or potential tissue damage. This type of pain can be further classified into somatic or visceral pain. Somatic pain arises from injuries to bones, joints, muscles, or skin, while visceral pain originates from internal organs (Woolf & Ma, 2007).
Neuropathic pain
Neuropathic pain results from damage or dysfunction within the somatosensory nervous system, which includes the peripheral and central nervous systems. This type of pain can involve various mechanisms, such as ectopic firing of damaged nerves, central sensitization, or abnormal processing of pain signals in the brain (Colloca et al., 2017).
Non-verbal pain
Pain can also manifest through nonverbal cues, such as facial expressions, body postures, and vocalizations. These nonverbal indicators can be handy for assessing pain in individuals who have difficulty communicating verbally, such as infants, young children, or individuals with cognitive impairments. Healthcare professionals can use this Nonverbal Pain Scale to measure and document how much pain a patient experiences.
References
Colloca, L., Ludman, T., Bouhassira, D., Baron, R., Dickenson, A. H., Yarnitsky, D., Freeman, R., Truini, A., Attal, N., Finnerup, N. B., Eccleston, C., Kalso, E., Bennett, D. L., Dworkin, R. H., & Raja, S. N. (2017). Neuropathic pain. Nature Reviews Disease Primers3, 17002. https://doi.org/10.1038/nrdp.2017.2
Hjermstad, M. J., Fayers, P. M., Haugen, D. F., Caraceni, A., Hanks, G. W., Loge, J. H., Fainsinger, R., Aass, N., Kaasa, S., & European Palliative Care Research Collaborative (EPCRC) (2011). Studies comparing numerical rating scales, verbal rating scales, and visual analogue scales for assessment of pain intensity in adults: A systematic literature review. Journal of Pain and Symptom Management41(6), 1073–1093. https://doi.org/10.1016/j.jpainsymman.2010.08.016
Melzack R. (1975). The McGill Pain Questionnaire: Major properties and scoring methods. Pain, 1(3), 277–299. https://doi.org/10.1016/0304-3959(75)90044-5
Treede, R. D., Rief, W., Barke, A., Aziz, Q., Bennett, M. I., Benoliel, R., Cohen, M., Evers, S., Finnerup, N. B., First, M. B., Giamberardino, M. A., Kaasa, S., Kosek, E., Lavand'homme, P., Nicholas, M., Perrot, S., Scholz, J., Schug, S., Smith, B. H., Svensson, P., … Wang, S. J. (2015). A classification of chronic pain for ICD-11. Pain, 156(6), 1003–1007. https://doi.org/10.1097/j.pain.0000000000000160
Polomano, R. C., Galloway, K. T., Kent, M. L., Brandon-Edwards, H., Kwon, K. N., Morales, C., & Buckenmaier, C., 3rd (2016). Psychometric testing of the Defense and Veterans Pain Rating Scale (DVPRS): A new pain scale for military population. Pain Medicine, 17(8), 1505–1519. https://doi.org/10.1093/pm/pnw105
Woolf, C. J., & Ma, Q. (2007). Nociceptors-noxious stimulus detectors. Neuron, 55(3), 353–364. https://doi.org/10.1016/j.neuron.2007.07.016
Commonly asked questions
Common Pain Level Charts include the Numeric Rating Scale (NRS), Visual Analog Scale (VAS), Verbal Rating Scale (VRS), and Wong-Baker FACES Pain Rating Scale. Each scale uses a different method to quantify pain, such as numbers, visual analogs, or descriptive words.
During a doctor visit, individuals are commonly asked to rate their pain intensity on the provided scale, with 0 typically representing no pain and the highest number or descriptor representing the worst imaginable pain.
The frequency of pain assessments depends on the individual's condition and treatment plan. Pain should be assessed regularly, especially when changes in pain intensity are expected or when adjusting pain management strategies.
Related Templates

Popular Templates