Sex Frequency by Age Chart
Access a free Sex Frequency by Age Chart PDF. Use our resource as a reference when discussing sexual health with your patients.


What is a Sex Frequency by Age Chart?
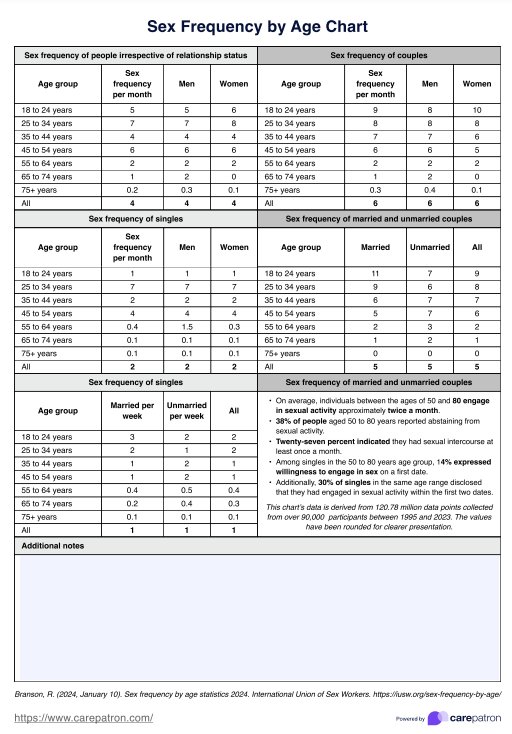
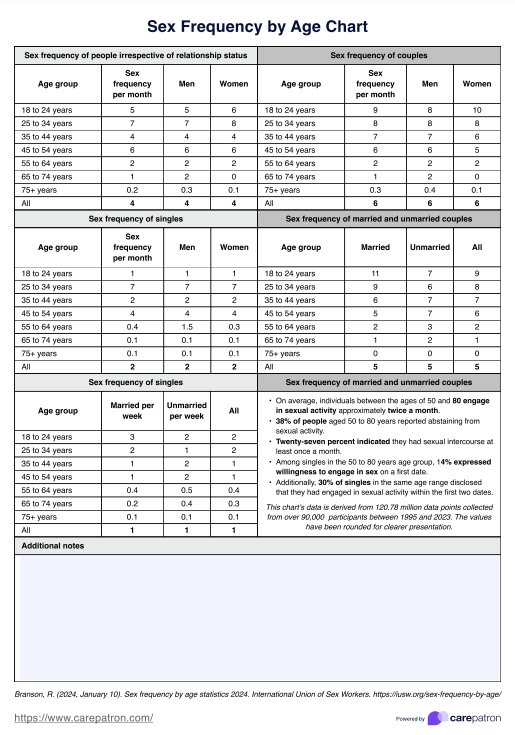
A Sex Frequency by Age Chart is a reference tool that provides healthcare professionals with insights into how often individuals, based on their age and relationship status, engage in sexual intercourse. This chart provides comprehensive statistics on the frequency of sexual activity, including how often married couples and other sexually active individuals engage in sexual acts like intercourse or oral sex. It also reflects trends in sexual satisfaction, showing whether people are having more or less sex as they age and how their relationship status can influence these patterns over time.
This chart can help healthcare professionals better understand sexual behavior across different age groups and relationship statuses. By analyzing data on how frequently individuals, healthcare providers can offer more personalized advice on sexual health and satisfaction.
However, it's important to note that while this chart offers valuable insight into sex frequency by age, there is no standard frequency of sexual activity that applies to everyone. More often than not, the “normal” frequency of sex is the frequency that two partners agree works best for them (Baxter, 2021).
Sexual needs and desires vary greatly between individuals and couples, depending on factors like personal preferences, relationship dynamics, health, and overall sexual satisfaction. This chart should be used as a guideline rather than a strict benchmark, as sexual frequency can differ significantly based on lifestyle, emotional intimacy, and physical well-being.
Sex Frequency By Age Template
Sex Frequency By Age Example
How does our Sex Frequency by Age Chart work?
Our Sex Frequency by Age Chart provides data from the International Union of Sex Workers who conducted a comprehensive assessment of worldwide sexual activity rates. The organization collected 120.78 million data points from over 90,000 participants, from 1995 to 2023 (Branson, 2024), providing data on frequency of sex per month, with some data presented as sex frequency per week, based on age and relationship statuses.
The data shown in our chart does not provide sex frequency based on the type of sex, but rather it offers a broad overview of the number of times individuals engage in any form of sexual activity.
Follow the steps below to use the chart:
Step 1: Access the chart
Get a copy of the Sex Frequency by Age Chart by clicking the "Use Template" button. This allows you to customize the template via the Carepatron app. You can also click "Download" for a PDF copy for easy printing.
Step 2: Select the relevant age group and relationship status
Once you have accessed the chart, identify the age group and relationship status of the individual or couple you are assessing. The chart provides detailed information for various age ranges, from 18 to over 75 years old. This will help you find the most relevant data for your specific case.
Step 3: Review the monthly sex frequency data
After selecting the appropriate category, review the data on the average number of times individuals engage in sexual activity per month. Keep in mind that these numbers represent general trends and may vary depending on individual circumstances.
Step 4: Use the data as a foundation
Use the data as a foundational reference during consultations to facilitate conversations about sexual health. The chart provides a benchmark for typical sexual activity, which can help you address any concerns patients or clients may have about their own sex frequency. The data can serve as a starting point for deeper discussions about sexual satisfaction, potential changes in frequency, and overall well-being.
When would you use this chart?
Here are some instances where our Sex Frequency by Age Chart can be beneficial:
Assessing sexual activity among peers
This chart is particularly useful when you need to assess and compare the sexual activity of individuals or couples within the same age group. By providing average frequencies of sexual activity, the chart allows you to evaluate whether a patient’s sexual behavior falls within typical ranges for their demographic.
Understanding changes in sexual desire
You can also utilize the chart to understand and discuss changes in sexual desire that may occur as individuals age. By comparing current sexual frequency with historical data—especially regarding how often individuals had frequent sex in the past—you can better understand the factors that may contribute to shifts in desire.
Addressing sexual dysfunction
The chart also serves as a valuable resource when addressing concerns related to sexual dysfunction. It provides benchmarks for what is considered typical sexual activity, allowing healthcare professionals to recognize when a patient may be experiencing issues that deviate from these norms. This information can be particularly helpful in discussing conditions that affect sexual health, such as erectile dysfunction or other barriers to maintaining a satisfying sexual relationship.
The relationship between sex frequency and age
Sexual activity declines with age, but the factors influencing this change vary significantly across different life stages.
Ueda et al. (2020) found that the proportion of young men aged 18-24 engaging in weekly sexual activity dropped from 51.8% to 37.4%, with factors like low income and part-time employment contributing to this decline. Men aged 25-34 experienced a similar decrease, reflecting broader societal shifts in sexual behavior. Women, particularly those aged 25-34, also saw a decline, with the proportion reporting weekly sexual activity falling from 66.4% to 54.2%. This suggests that economic and lifestyle changes are affecting sexual frequency among younger adults of both sexes.
As individuals age, sexual activity often decreases, yet it remains a vital aspect of life for many. Gore-Gorszewska et al. (2023) investigated sexual function in older adults, highlighting that those in partnered relationships engage in sex more frequently than their single counterparts. The study focused on differences between men and women, particularly among baby boomers now in their 60s. Key factors influencing sexual activity in later life include physical health, relationship status, and prior sexual behavior. Notably, while declining health impacts men's sexual frequency, the connection between men's health and sexual activity tends to strengthen with age. In contrast, women's health appears to play a lesser role in their decline in sexual activity.
Karraker et al. (2011) also emphasize that marital status significantly influences sexual activity, with married individuals reporting more frequent sex. However, emotional factors such as happiness and satisfaction become increasingly important in later life. For men, physical health accounts for about 10% of the overall decline in sexual frequency, with the association between health and sexual activity shifting from negative to positive as they age. For women, rising widowhood and a lower proportion of never-married women contribute to declines in sexual encounters.
In summary, sexual activity tends to decline with age due to a combination of factors, including marital status, health, and emotional well-being, which differ for men and women. Understanding these dynamics is essential for addressing the sexual health and quality of life of older adults, as maintaining fulfilling sexual relationships remains a significant aspect of their overall well-being.
References
Baxter, R. (2021, September 6). What is the “normal” frequency of sex? International Society for Sexual Medicine. https://www.issm.info/sexual-health-qa/what-is-the-normal-frequency-of-sex
Branson, R. (2024, January 10). Sex frequency by age statistics 2024. International Union of Sex Workers. https://iusw.org/sex-frequency-by-age/
Gore-Gorszewska, G., Ševčíková, A., & Gottfried, J. (2023). Predicting changes to sexual activity in later life: A longitudinal study. Sexuality Research and Social Policy. https://doi.org/10.1007/s13178-023-00853-9
Karraker, A., DeLamater, J., & Schwartz, C. R. (2011). Sexual frequency decline from midlife to later life. The Journals of Gerontology Series B: Psychological Sciences and Social Sciences, 66B(4), 502–512. https://doi.org/10.1093/geronb/gbr058
Ueda, P., Mercer, C. H., Ghaznavi, C., & Herbenick, D. (2020). Trends in frequency of sexual activity and number of sexual partners among adults aged 18 to 44 years in the US, 2000-2018. JAMA Network Open, 3(6), e203833. https://doi.org/10.1001/jamanetworkopen.2020.3833
Commonly asked questions
The normal sex frequency varies by age, reflecting changes in libido, health, and relationship dynamics. Generally, younger adults (ages 18-29) tend to have the highest sexual frequency. This frequency gradually decreases as individuals age. By the time individuals reach their 60s and beyond, the frequency may drop to 2-4 times per month, influenced by factors such as hormonal changes, health issues, and relationship status.
There is no one-size-fits-all answer to how often couples should have sex, as it largely depends on individual preferences, relationship dynamics, and circumstances. The key is open communication between partners to determine what feels right for both individuals.
The sexual desires of a 55-year-old woman can vary widely based on individual factors such as health, relationship status, and personal libido. On average, women in this age group may desire sex about 2-4 times per month, although many may experience fluctuations influenced by hormonal changes associated with menopause, relationship dynamics, and life stressors.


