Normal Blood Sugar Levels Chart

Understand how a Normal Blood Sugar Levels Chart works. Get access to a free PDF template and example in this guide.

By Ericka Pingol on Oct 02, 2024.

tick

Fact Checked by Nate Lacson.

Use Template
AI IconToolbarShare ui

What are normal blood sugar levels?

Following the crucial role of blood sugar management in patient care, let's delve deeper and explore the concept of "normal blood sugar level." These levels refer to the optimal range of glucose concentrations within the bloodstream necessary for proper bodily function. Maintaining blood sugar within this healthy zone is essential for preventing various health complications and effectively managing conditions for people with diabetes.

There are two primary methods for monitoring blood sugar levels:

  1. A1C Test: This blood sugar test provides an average of a person's blood sugar control over 2-3 months. It measures the percentage of hemoglobin proteins in the blood that have glucose attached (glycated hemoglobin). The American Diabetes Association (ADA) recommends an A1C level below 7% for optimal health.
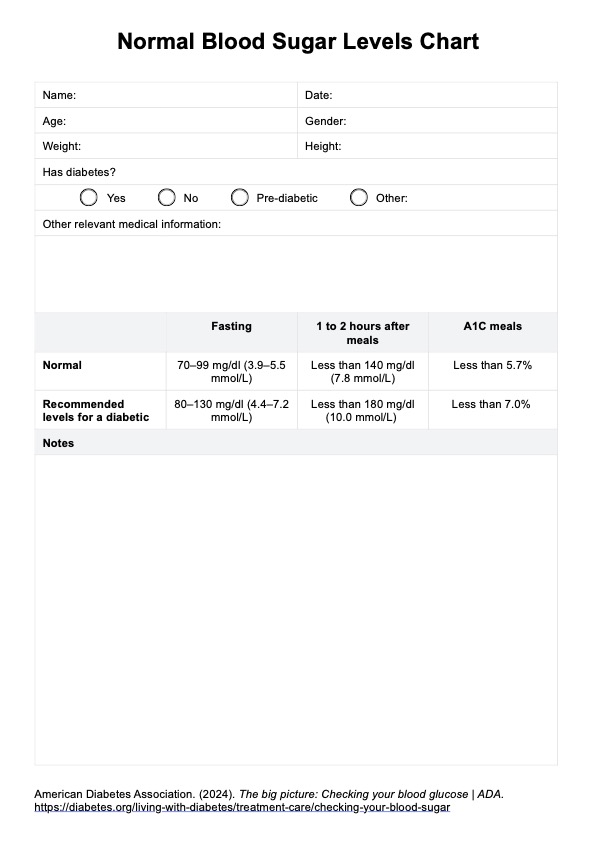
  2. Self-monitoring of blood glucose (SMBG): People with diabetes often utilize finger pricking and a test strip to monitor their blood glucose numbers throughout the day. Having an ADA blood sugar log helps identify patterns and ensure blood sugar remains within the target range specified by a healthcare professional. According to the American Diabetes Association (2024), the normal blood sugar ranges are as follows:
    • A1C: Less than 7%
    • A1C may also be reported as eAG: Less than 154 mg/dL
    • Before a meal (preprandial plasma glucose): 80–130 mg/dL
    • 1-2 hours after the beginning of the meal (postprandial plasma glucose): Less than 180 mg/dL

Other methods for measuring blood glucose or sugar are the oral glucose tolerance test (OGTT), fasting plasma glucose (FPG) test, and continuous glucose monitor (CGM).

It's important to note that these are general guidelines, and individual variations may occur based on age, gender, and overall health. For instance, depending on the client, one can refer to an elderly blood sugar levels chart or one for children. Healthcare professionals must consider these factors when interpreting blood sugar levels and making treatment decisions.

Normal Blood Sugar Levels Chart Template

Download PDF Template

Normal Blood Sugar Levels Chart Example

Download Example PDF

How does our Normal Blood Sugar Levels Chart template work?

A Normal Blood Sugar Levels Chart is a valuable tool for healthcare professionals and patients. This outlines target blood sugar ranges categorized by factors such as fasting state or time after eating. By referencing these guidelines, healthcare professionals can assess an individual's blood sugar levels and determine if they fall within the normal range. This information is particularly crucial for managing diabetes, as chronically high blood sugar levels are central to this condition.

Our free and printable blood sugar chart PDF template provides an easy-to-use guide for blood glucose monitoring. Follow these steps to get started:

Step 1: Access the free template

Download a copy of the Normal Blood Sugar Levels Chart PDF using the link on this page or from the Carepatron app. You can also access it from our handy resources library.

Step 2: Explain how it works

Explain how the Normal Blood Sugar Levels Chart works by discussing target blood sugar levels and the timing of meals. You can also use this opportunity to discuss lifestyle strategies to help them regulate their blood sugar levels.

Step 3: Ask questions

Ask your patient questions about their current blood sugar levels, what meals they eat during the day, and their lifestyle habits. Ask them how they feel after eating certain foods or about any symptoms they experience when their blood sugar is high or low.

Step 4: Analyze the patient's blood glucose levels

Based on the A1C test, a three-month average of blood sugar levels, and the answers to the questions you've asked your patient, determine your patient's blood sugar level.

Step 5: Develop lifestyle strategies

Develop lifestyle strategies to help your patient regulate their blood sugar levels. You can recommend they increase their physical activity, adjust their diet, take medication if needed, and monitor blood glucose through regular diabetes tests. You can also encourage them to keep a blood sugar log to keep track of their blood sugar levels or note when they observe high blood sugar.

When would you use this template?

This Normal Blood Sugar Levels form can be used to quickly and effectively document blood sugar levels over some time by any medical care provider involved in treating patients with diabetes, like nurses, dietitians, and endocrinologists in any setting, from hospitals to long-term care facilities. This template can be used for the following benefits:

Compare blood sugar levels before and after meals

Healthcare professionals can use or give their patients this Normal Blood Sugar Levels Chart to track the change in sugar levels throughout the day. Using the chart with a blood sugar log may help one identify factors affecting your patient's blood sugar levels and causing a low or elevated blood sugar levels, such as diet, stress, physical activity, and medications.

Keep track of blood glucose targets

A blood glucose levels chart can document a patient's blood sugar levels over weeks or months. This may help identify patterns that could indicate a pre-diabetes or diabetes diagnosis.

Record sugar levels before and after exercise

If you are using the Normal Blood Sugar Levels Chart to monitor a patient's blood sugar levels, it is important to document any changes before and after physical activity. This will help one better understand the impact of exercise on the patient's blood sugar levels and inform any adjustments to the patient's diet, activity level, or medications.

Be aware of warning signs

Uncontrolled high or low blood glucose levels can lead to serious and dangerous health complications like digestive and kidney diseases and cardiovascular disease, so it is important to be aware of any warning signs that indicate the need for immediate medical attention. This template allows practitioners to monitor changes in the patient's blood sugar levels quickly and easily. It can be used alongside a low blood sugar levels chart to monitor fluctuations properly.

How important are normal blood sugar levels?

Blood sugar, or blood glucose, is the fuel that keeps our bodies running. It’s the primary energy source for our cells, and maintaining healthy blood sugar levels is crucial for overall well-being. However, imbalances can lead to a variety of health concerns. Chronically high blood sugar levels are a hallmark of diabetes, while excessively low levels can cause hypoglycemia, leading to shakiness, sweating, and even confusion.

In individuals with diabetes, there is a problem with insulin production or utilization. In type 1 diabetes, the body doesn’t produce enough insulin due to damage to the beta cells in the pancreas. In type 2 diabetes, the body becomes less responsive to insulin, making it harder for cells to take in and use glucose effectively. As a result, glucose builds up in the bloodstream, leading to high blood sugar levels, also known as hyperglycemia.

Effectively managing blood glucose levels is essential in patient care. Healthcare professionals are vital in identifying potential imbalances and developing personalized treatment plans.

Non-Fasting Blood Sugar Levels Chart PDF

In addition to the standard normal blood glucose level guidelines, healthcare professionals use non-fasting blood sugar levels to assess an individual's overall glucose control. Non-fasting blood sugar tests, also known as random blood sugar tests, measure the amount of glucose in the blood at any given time, regardless of when the person last ate.

The non-fasting blood sugar level chart provides a reference range for healthcare practitioners to quickly identify if a person's random blood sugar levels fall within the normal, prediabetic, or diabetic range. This information can be used alongside the traditional fasting blood sugar and A1C tests to get a more comprehensive picture of an individual's blood sugar management.

If this can be a helpful resource for your practice, please view this Non-Fasting Blood Sugar Level Chart or download it as a PDF for easier access.

Fasting Blood Sugar Levels Chart PDF

Understanding normal fasting blood sugar levels is also crucial for managing and monitoring various health conditions, including diabetes. Fasting means not consuming calories (except water) for at least 8 hours before a blood test. Fasting blood sugar levels are a reliable indicator of how well your body regulates blood sugar when it hasn't eaten recently.

Blood sugar levels are typically measured in milligrams per deciliter (mg/dL) and can vary depending on the time of day, recent meals, and physical activity. Normal ranges differ for those with and without diabetes. Here is a detailed chart explaining these levels:

  • Normal range: 70-99 mg/dL
  • Prediabetes range: 100-125 mg/dL
  • Diabetes range: 126 mg/dL or higher

Continuous glucose monitoring promotes early detection of abnormal glucose levels, facilitating timely intervention. It can be more efficient to have these blood sugar level charts as a handy reference when working with clients. If a Fasting Blood Sugar Levels Chart is helpful for your practice, feel free to check out a preview of this template or download it as a PDF.

Reference

American Diabetes Association. (2024). The big picture: Checking your blood glucose | ADA. https://diabetes.org/living-with-diabetes/treatment-care/checking-your-blood-sugar

How can a Normal Blood Sugar Levels Chart benefit patient care?

Commonly asked questions

How can a Normal Blood Sugar Levels Chart benefit patient care?

This chart allows healthcare professionals to easily compare blood sugar readings against target ranges. This visual tool helps identify potential issues and allows for informed decisions about treatment plans. It can also empower patients to track their blood sugar levels and understand their progress.
When would you use a Non-Fasting Blood Sugar Level Chart?

While fasting blood sugar tests are common, non-fasting tests provide a snapshot of blood sugar levels at any time. This can be helpful in situations where a patient might not be able to fast beforehand, offering additional data points for a more comprehensive blood sugar picture.

Can the glucose levels chart for adults vary with age?

Yes, the glucose target levels on the chart might be adjusted based on age, the presence of other health conditions, the higher risk of hypoglycemia, or other factors. It is crucial to consult with a healthcare provider for the most applicable targets.

Join 10,000+ teams using Carepatron to be more productive

One app for all your healthcare work