Troponin Levels
Have this invaluable chart on hand when analyzing and interpreting troponin levels for the important and critical diagnosis of cardiac injury. Click here to download your free template.

Fact Checked by Ericka Pingol.


What is a Troponin Levels Chart?
A Troponin Levels Chart is an important and well-utilized medical resource that assists healthcare practitioners in delineating the normal and significantly elevated levels of troponin in the bloodstream. It is important in emergency medicine and cardiac health as its ability to record troponin measures can help diagnose cardiac injury and patients at risk of developing cardiac-related conditions.
To provide an overview of the importance of the resource, the chart mainly exists to collate the presence of three specific cardiac structural proteins (troponin C, troponin I, and troponin T). The presence of troponin T and troponin I indicates a heart injury, such as a myocardial infarction (heart attack). Troponin levels are detectable 3-4 hours after the cardiac event, dramatically increasing over 12 hours and peaking at around 24 hours post-event. The levels remain high for several days but are expected to lower later.
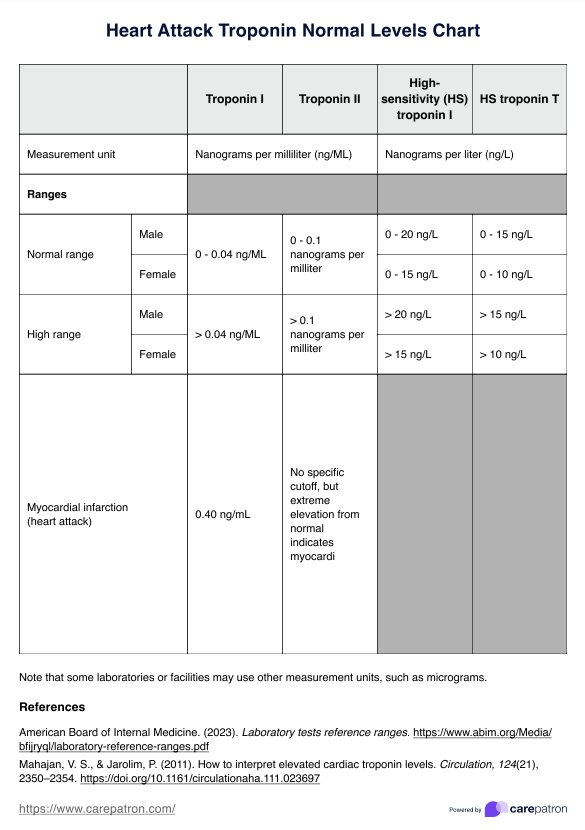
Do note that the blood's normal range differs slightly between institutions. However, in our take on a Troponin Levels Chart, you will find values accepted and used by the majority.
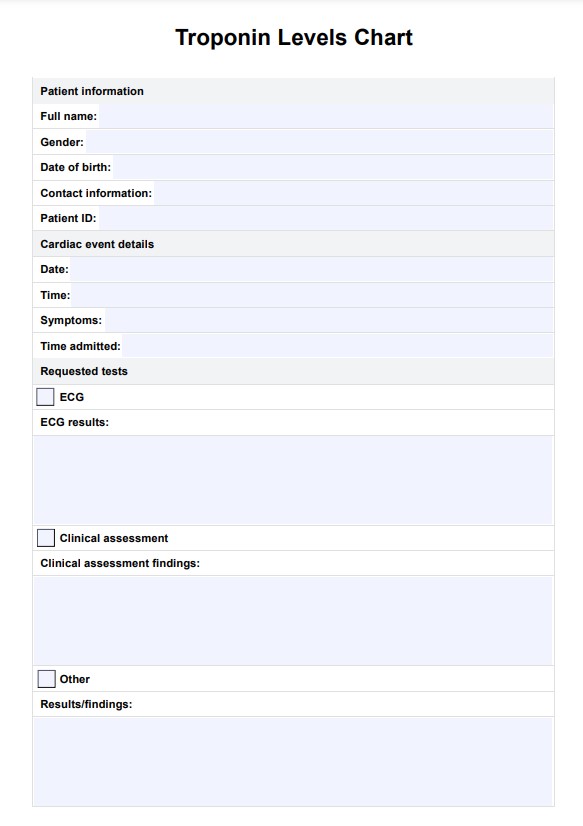
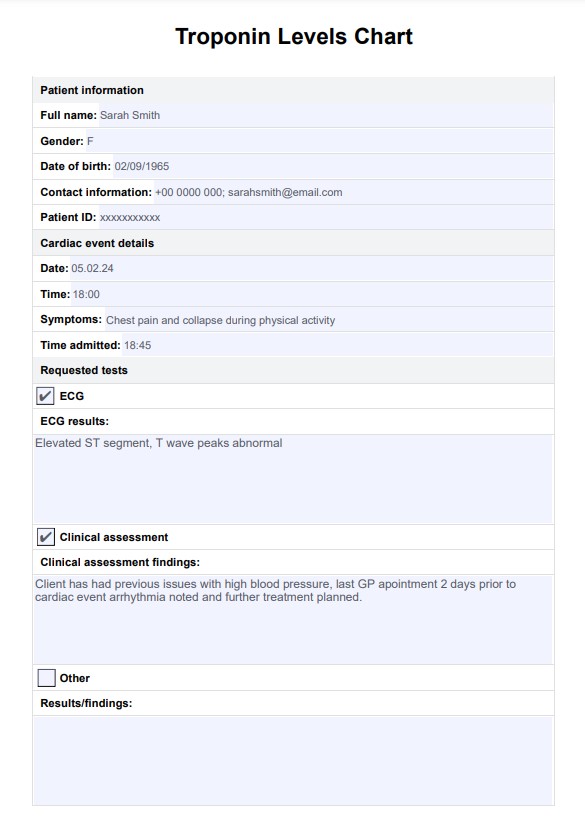
Troponin Levels Template
Troponin Levels Example
How does the Troponin Levels Chart work?
The following are steps you can follow to use our Troponin Levels Chart:
Step 1: Gather your resources
Troponin Level Charts are a valuable resource to keep on hand. Ensure you have one when the need arises by clicking the “Download Template” or “Use Template” button.
Step 2: Collate essential information
If you are using this chart as part of an MI diagnosis, clinical assessment notes and echocardiogram analysis are essential aspects of the chart to fill in, as well as the troponin level results from the obtained blood sample.
If using this chart to decipher an elevated troponin level in the absence of MI, record the data in the chart. Note that troponin-level charting can not formulate a diagnosis. It is a tool used in collaboration with other tests.
Step 3: Store the template securely
After reviewing the results and hosting a consultation with your patient and/or relevant specialists, you need to secure the troponin levels test results chart so that access is only granted to relevant parties. Ensure this through Carepatrons' HIPAA-compliant free patient records software.
When would you use the Troponin Levels Chart?
Troponin level charting is a common and well-utilized tool that helps with the crucial diagnosis of MI. Yet, it also has the potential to assist in diagnosing other medical conditions, both cardiac and non-cardiac related. See the suite of options for this particular chart use below:
Help formulate MI diagnosis
Using the cardiac troponin test alongside a risk assessment and echocardiogram (ECG) helps formulate the diagnosis of a myocardial infarction. The results of a troponin test cannot form a diagnosis on their own; rather, they are an aspect of diagnosis.
Help indicate the need for further tests
An elevated troponin level result can indicate the need for further testing for cardiac causes such as congestive heart failure, coronary artery disease, myocarditis, and aortic valve disease. Using the Troponin Levels Chart to assist in recording and planning for further testing allows for quick and easy reflection on these results, allowing for the future management and treatment of serious cardiac causes.
Help with diagnosis and treatment of other conditions
Conditions such as chronic kidney disease, pulmonary embolism (blood clot in the lungs), and sepsis can also cause troponin levels to rise, making this chart a viable step in treating and diagnosing such conditions. Over-exercising and extreme emotional turmoil, such as severe grief and stress, can also be indicated through raised troponin levels.
Results and interpretation of the Troponin Levels Chart
The laboratory results for troponin values can be analyzed with other testing tools to make important diagnosis decisions. Below are the parameters and interpretations of troponin values:
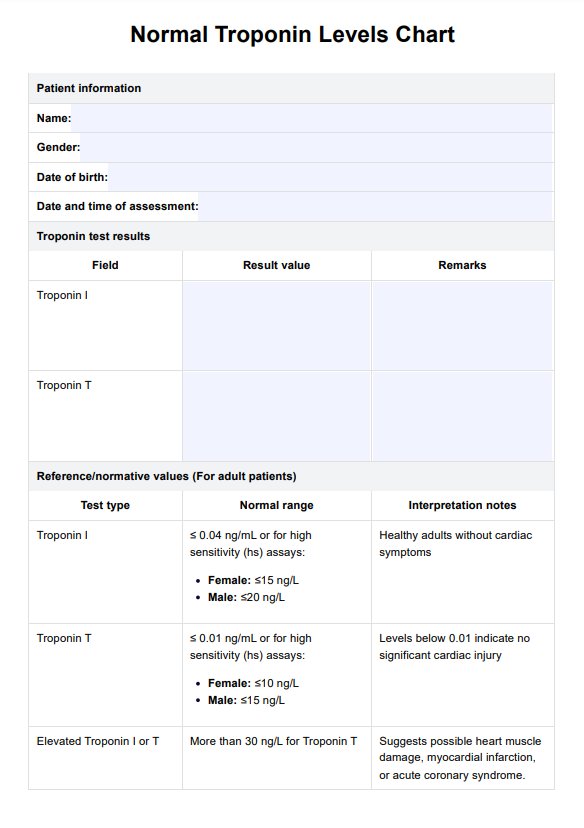
- Normal without symptoms: Troponin I ≤ 0.04 ng/ml ; Troponin T ≤ 0.01ng/ml
- Possible MI: hs Troponin T 14 - 30 ng/l
Clinical assessment and medical history review are needed to help determine the clinical context. Further testing is encouraged. If the patient is low-risk and stable, a second troponin test should be after the initial test.
- Probable MI: hs Troponin T > 30 ng/l
Urgent treatment is required if the patient has significant or elevated troponin levels, as this is likely the result of a serious cardiac event.
Abnormal troponin levels can also suggest other health issues, and the results should be considered with other testing methods, such as clinical and symptom assessment and an ECG, in addition to a simple blood test.
Research & evidence
A troponin levels test is an incredibly valuable tool that has seen much development in recent years. Introducing high sensitivity troponin tests means precise measurements can be made at low concentrations, leading to early detection and diagnosis. This updated, and more precise troponin test typically measures the hs Troponin T biomarker. Hence, all parameters in this guide relate to high sensitivity cardiac troponin T (MedicineNet, 2022).
The troponin tests are prevalent in cardiac injury cases because they are proven biomarkers of heart muscle cell damage. Cell breakdown and troponin release occur when blood flow to the heart muscle through the coronary vessels is blocked. This lack of oxygen causes necrosis and the cell's death (Stark & Sharma, 2023). Troponin I only exists within the heart muscle. Troponin T holds a unique structure inside the heart muscle, making it identifiable and unique compared to the small amount of Troponin T that exists elsewhere in the body. When the cells are damaged, these unique proteins become present in circulating blood.
Interestingly, there is work on the event of cardiac injury but little to no increase in the presence of troponin. These results highlight the importance of taking blood 2 to 3 hours after a suspected event to allow the troponin to be detectable within the bloodstream. Research has also been done on the interference of vitamin B7 or biotin (Cleveland Clinic, 2022). This vitamin can affect the result, and it is paramount that medical history, medication usage, and dosage are all checked.
References
Cleveland Clinic. (2022, March 17). Troponin test: What it is and normal range. Cleveland Clinic. https://my.clevelandclinic.org/health/diagnostics/22770-troponin-test
Cunha, J. P. (2022, October 3). 13 reasons for high-sensitivity troponin test, normal & high ranges. MedicineNet. https://www.medicinenet.com/high_sensitivity_troponin_test_ranges_and_values/article.htm
Stark, M., & Sharma, S. (2023, April 23). Troponin. PubMed; StatPearls Publishing. https://www.ncbi.nlm.nih.gov/books/NBK507805/
Villines, Z. (2019, June 7). What is the normal range for troponin levels? Medical News Today. https://www.medicalnewstoday.com/articles/325415
Commonly asked questions
Medical professionals who suspect a recent heart attack or those working in hospital emergency departments most commonly request this test.
Troponin level charts are commonly used in conjunction with clinical assessment and ECG testing to help diagnose a heart attack. The test may also be conducted if there is suspicion of other cardiac conditions or damage.
Medical professionals use the Troponin Levels Chart to collate blood testing results easily and efficiently for quick access to help diagnose serious cardiac events.
With available blood results, a Troponin Levels Chart will take less than 10 minutes to complete.
Related Templates

Popular Templates