Normal Troponin Levels
Use our Normal Troponin Levels Chart as a valuable tool in monitoring your patient’s condition post-heart attack.


What is a Normal Troponin Levels Chart?
A Normal Troponin Levels Chart is a clinical tool used to interpret the results of a troponin test, which measures troponin levels in the blood. Troponin is a protein found in heart muscle cells released into the bloodstream when there is damage to the heart. According to Stark and colleagues (2023), elevated troponin levels often signal issues such as a heart attack, acute coronary syndrome, or other cardiac conditions. Typically, a high-sensitivity cardiac troponin test, also called a high-sensitivity troponin test, is conducted to detect even the smallest increase in levels of troponin in the blood.
Troponin testing is especially important when symptoms like chest pain are present, as elevated levels can indicate that the blood flow to the heart has been blocked, potentially by a blood clot. By examining the Normal Troponin Levels Chart, healthcare providers can understand whether troponin levels are within a safe range or if they are dangerously high. This chart is typically used alongside other diagnostic tools, like a blood test or blood sample, to monitor heart health accurately. Tracking troponin levels enables early intervention, crucial for managing heart-related conditions and ensuring timely treatment when heart damage is detected.
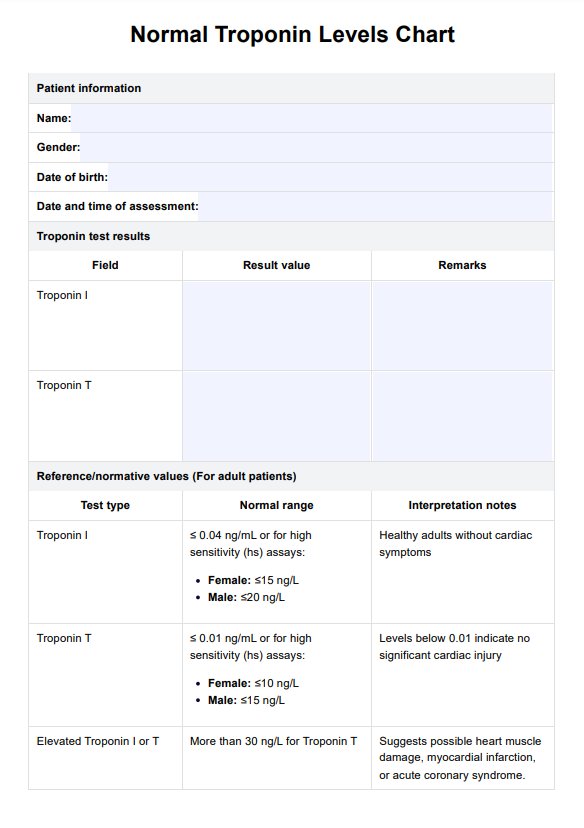
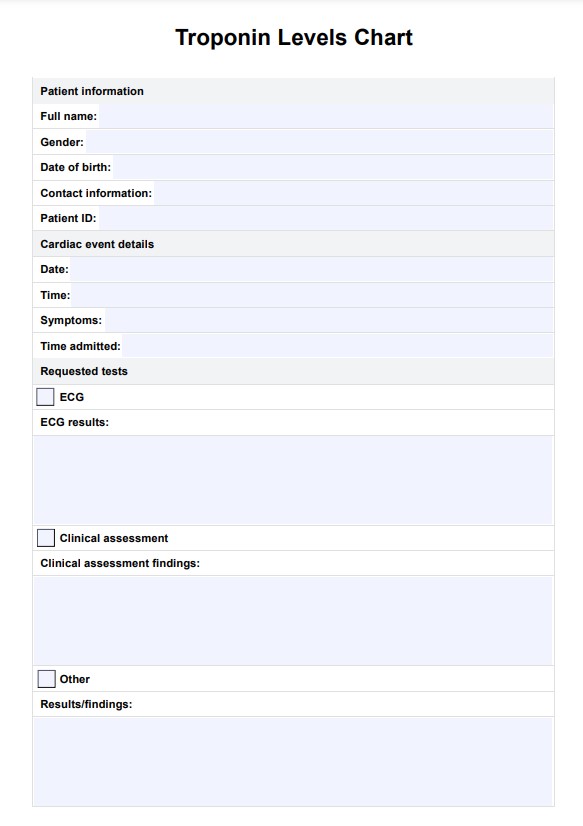
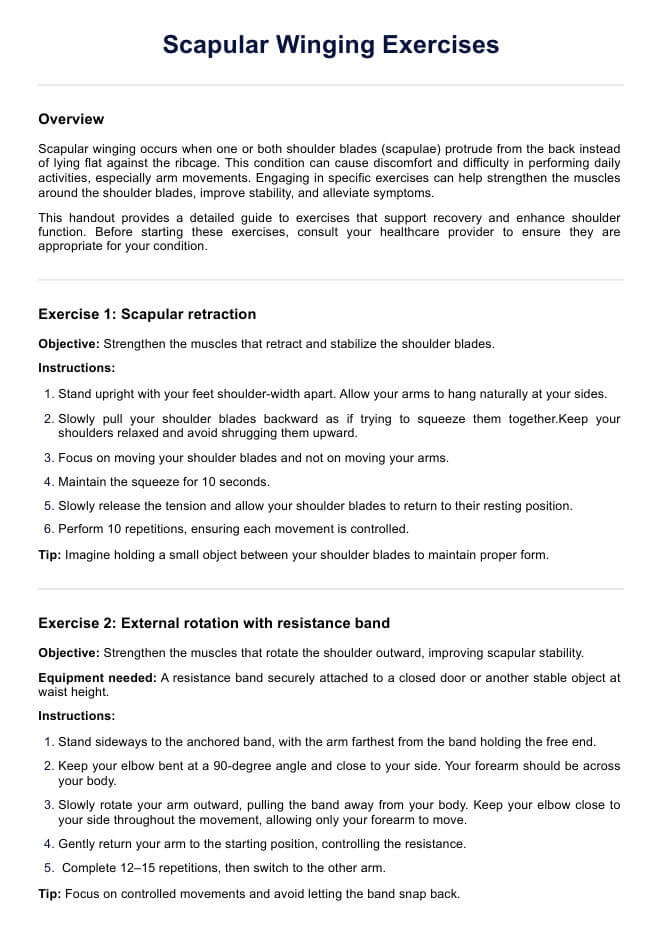
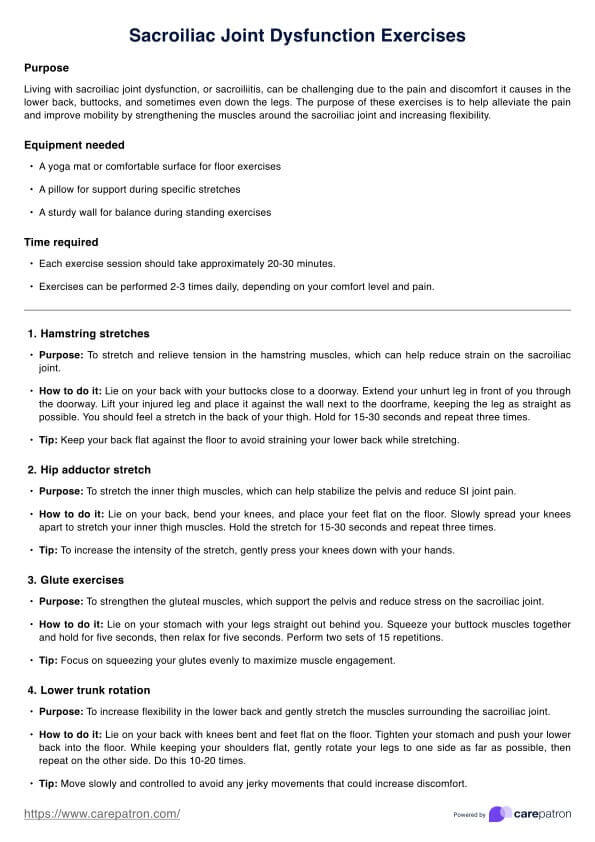
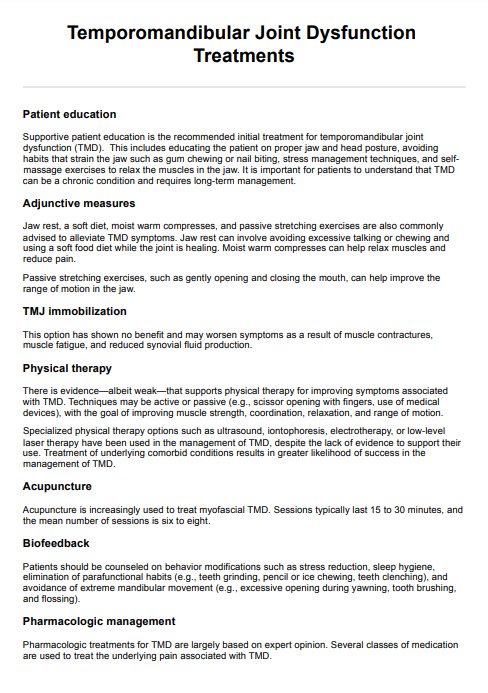
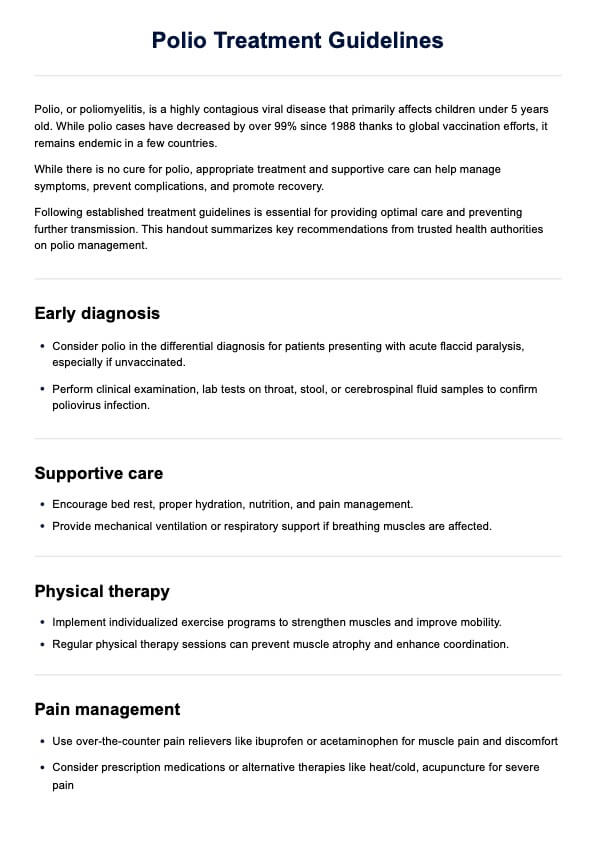
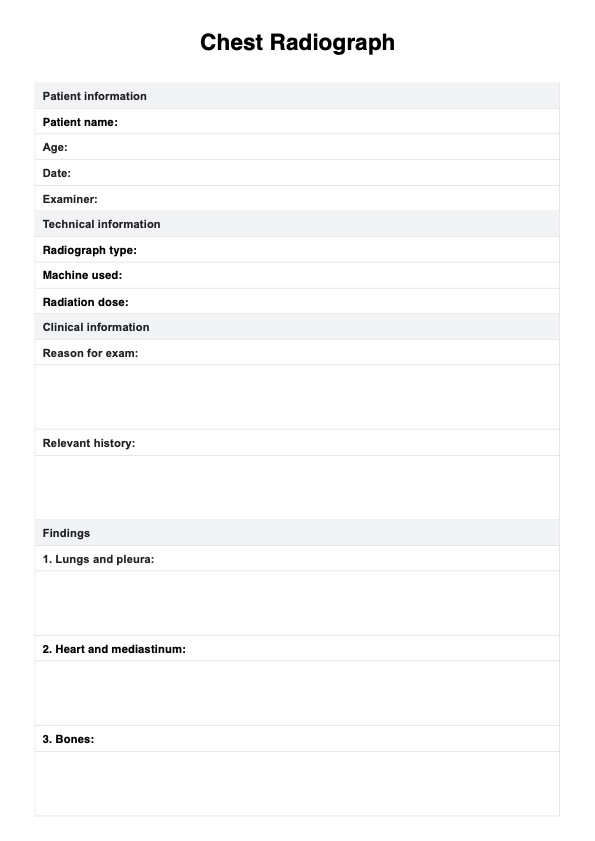
Normal Troponin Levels Template
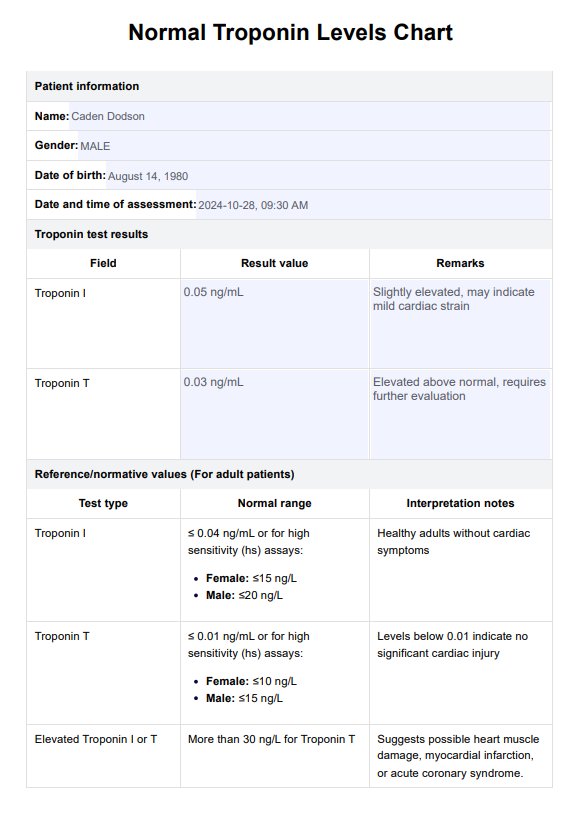
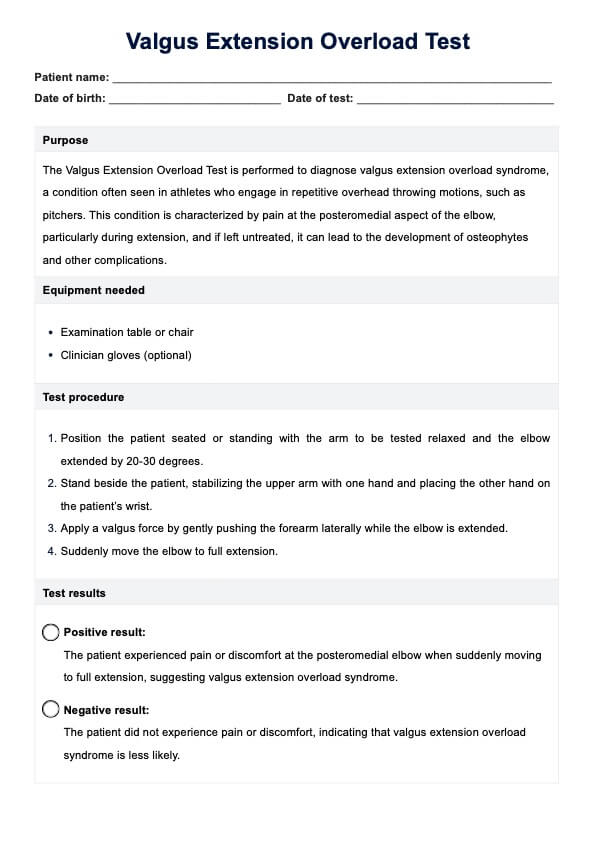
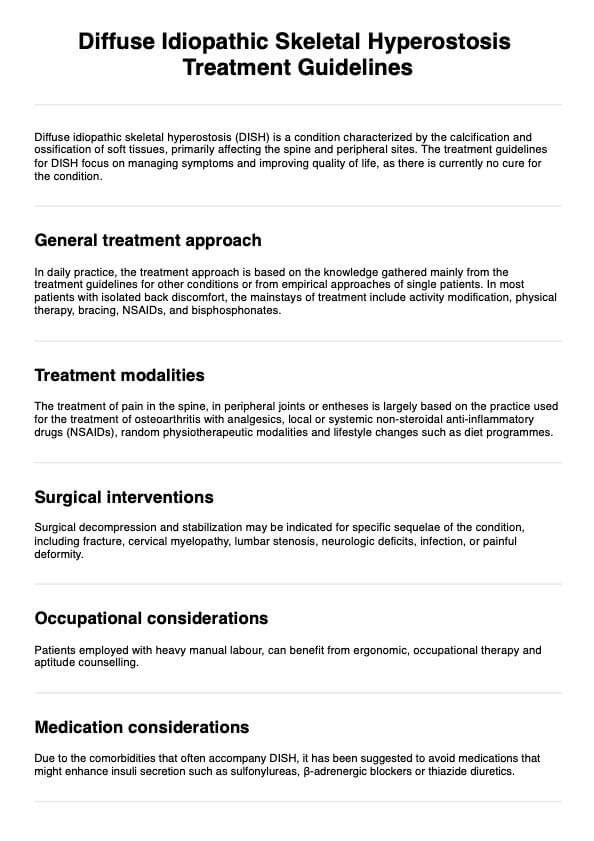
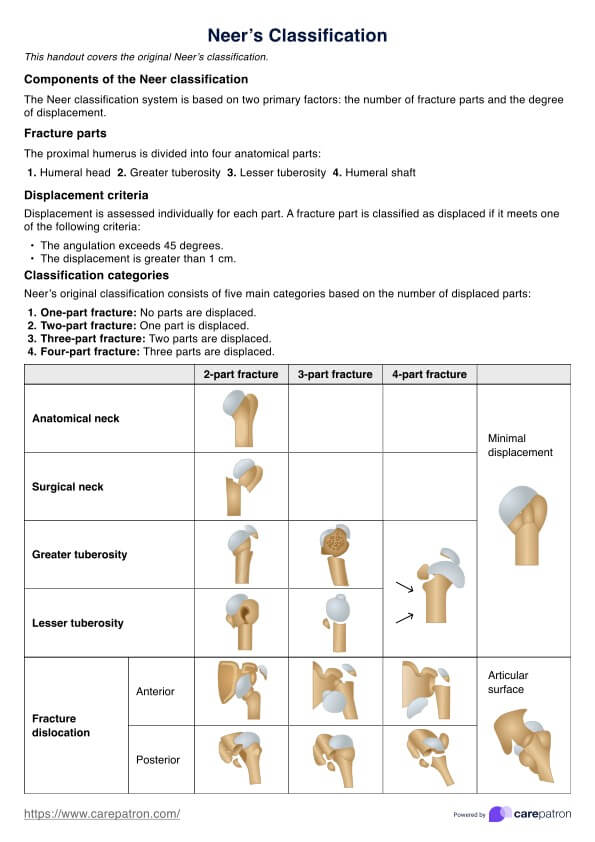
Normal Troponin Levels Example
How does it work?
Carepatron’s Normal Troponin Levels Chart is a practical tool designed to assist healthcare professionals in interpreting troponin test results efficiently. By following a few simple steps, practitioners can utilize this chart to assess troponin levels, educate patients, and make informed decisions about the next steps in care.
Step 1: Access the chart
The Normal Troponin Levels Chart template can be accessed within this guide, making it readily available for quick reference. This tool is formatted to help healthcare providers quickly locate and interpret normal and elevated troponin levels, allowing for a streamlined assessment process.
Step 2: Introduce the chart to patient
Once you have the chart, briefly explain its purpose to the patient. Let them know that the chart is used to interpret troponin levels detected by their blood test, helping to determine if they may be at risk for conditions like acute coronary syndrome or a heart attack.
Step 3: Use the chart for patient assessment
With the patient’s troponin test results in hand, use the chart to compare their troponin levels to standard ranges. This enables a quick assessment of whether elevated troponin levels are present, which can indicate heart muscle damage or impaired blood flow.
Step 4: Discuss findings
After assessing, share the findings with the patient. Clearly explain if their troponin levels are within the normal range or elevated and what this might mean regarding possible conditions like acute coronary syndrome or blood clot risks based on their individual health context.
Step 5: Provide patient education and next steps
Finally, offer guidance on the next steps. Educate the patient on the significance of their high-sensitivity cardiac troponin test results, potential treatments, and lifestyle adjustments. Emphasize the importance of follow-up care and, if necessary, additional testing to monitor any changes in troponin levels over time.
What do the results mean?
Troponin tests are vital in diagnosing heart conditions, especially myocardial infarction (MI). Here’s a detailed look at positive and negative interpretations of troponin levels according to North Bristol NHS Trust (n.d.):
Normal range
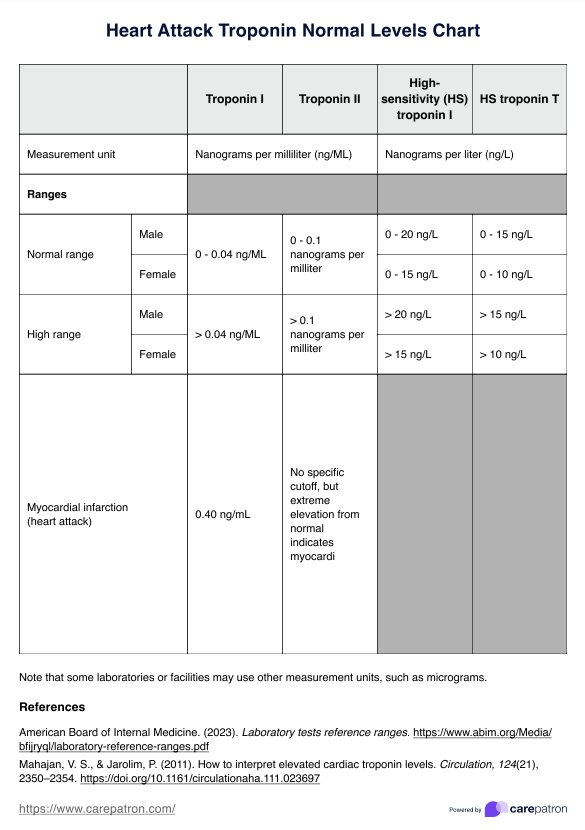
Normal troponin levels (≤ 0.04 ng/mL for troponin I or ≤0.01 ng/mL for troponin T) generally rule out significant myocardial injury, especially if tested more than six hours after symptom onset. It is important to note that troponin levels may not rise immediately after a heart attack, leading to potential false negatives if tested too early.
Abnormal range
If the troponin T ranges from 14-30 ng/L, this suggests possible myocardial infarction. Further evaluation of symptoms and risk factors is essential. A second sample may be needed to observe changes over time.
Severe range
Moreover, if the levels go beyond 30 ng/L, this threshold strongly indicates an acute myocardial infarction. The higher the troponin level, the greater the likelihood of significant cardiac injury.
When would you use this chart?
The Normal Troponin Levels Chart is essential for identifying and monitoring cardiac-related issues. Medical professionals use this chart in several situations to interpret troponin tests and make informed decisions about patient care, especially when assessing potential heart conditions and injury to heart tissue.
Chest pain evaluation
When a patient presents with chest pain, a primary concern is determining whether it indicates a heart attack or other cardiac issues. In such cases, troponin tests are ordered to measure troponin proteins released by damaged heart muscle cells. Comparing the results against the Normal Troponin Levels Chart helps determine if further action is needed.
Diagnosing myocardial infarction
A myocardial infarction, or heart attack, is confirmed when elevated, high-sensitive cardiac troponin levels are detected. Multiple blood tests are often used to monitor any rise over time. This chart assists healthcare providers in verifying whether troponin levels match the profile of an MI, providing a clear diagnostic pathway for patients with suspected heart attacks.
Assessing congestive heart failure and cardiac injury
In cases of congestive heart failure, cardiac inflammation, or other cardiac injury, troponin tests are valuable in assessing the degree of damage to the heart muscle. This chart helps healthcare providers monitor fluctuations in troponin levels, which can signal worsening heart conditions or the need for adjusted treatments.
References
Stark, M., Kerndt, C., & Sharma, S. (2023, April 23). Troponin. PubMed; StatPearls Publishing. https://www.ncbi.nlm.nih.gov/books/NBK507805/
North Bristol NHS Trust. (n.d.). Troponin fact sheet for primary care. https://www.nbt.nhs.uk/sites/default/files/Trop%20w%20%20header.pdf
Commonly asked questions
An alarming troponin level is typically any value significantly above the standard reference range. Typically, levels above 0.04 ng/mL for troponin I or 0.01 ng/mL for troponin T indicate potential heart muscle damage. Values significantly above these thresholds suggest a higher likelihood of serious cardiac events, such as a heart attack, necessitating immediate medical attention.
Normal troponin levels are generally very low, often below 0.04 ng/mL for Troponin I, indicating no detectable heart muscle damage. Values within this range suggest healthy cardiac function, commonly found in individuals without symptoms of heart distress.
Yes, a troponin level of 12 ng/mL is considered extremely elevated and likely indicates significant cardiac injury. The standard reference range for troponin levels is typically 0–0.04 ng/mL for troponin I and 0–0.01 ng/mL for troponin T. Levels above these thresholds suggest heart muscle damage. Such high levels warrant urgent medical intervention to prevent further heart damage.
A high troponin level indicates potential damage to the heart muscle, often due to a heart attack, severe strain, or other cardiac conditions. It is a marker of cardiac injury and requires further assessment and possible intervention.


