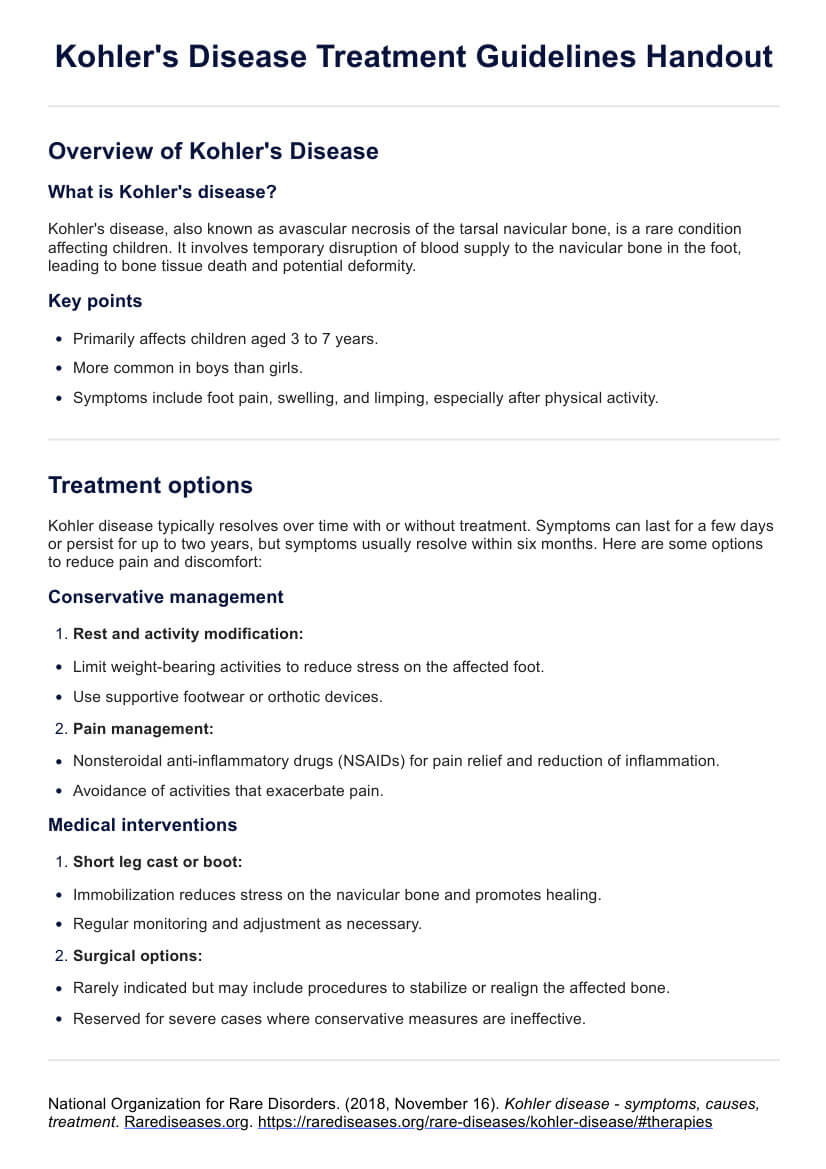
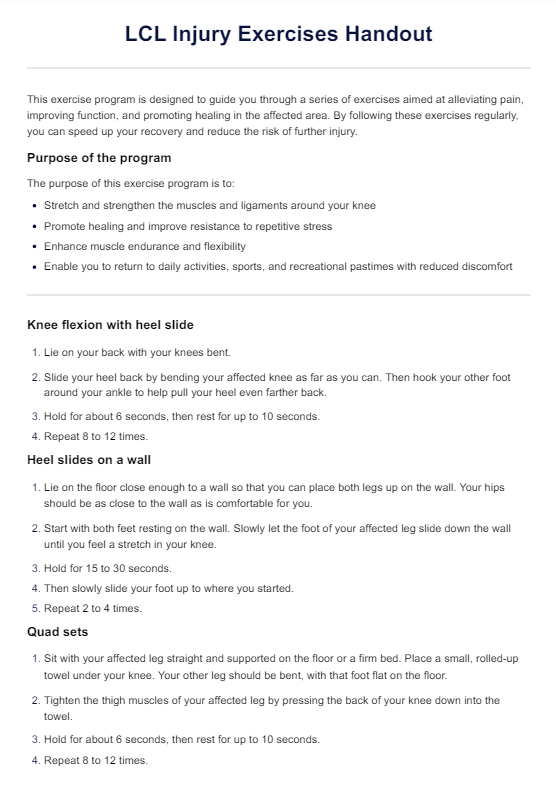
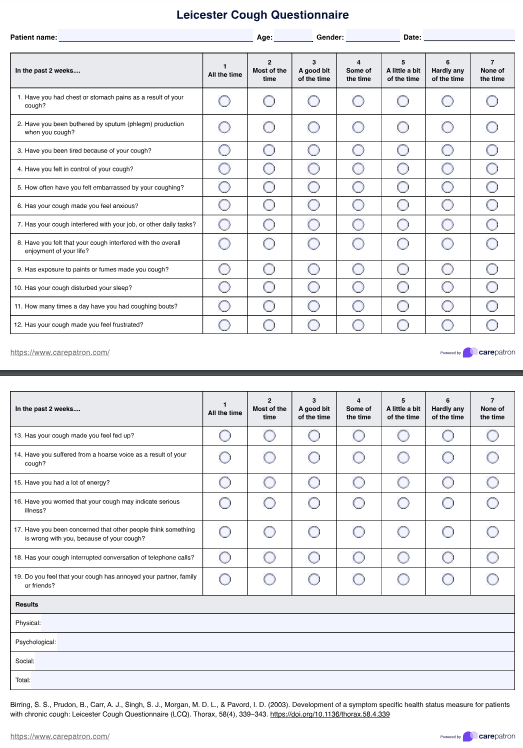
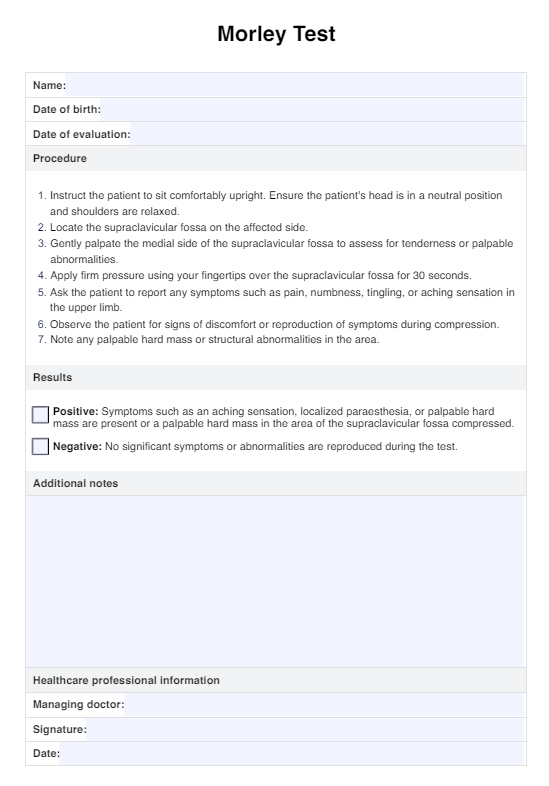
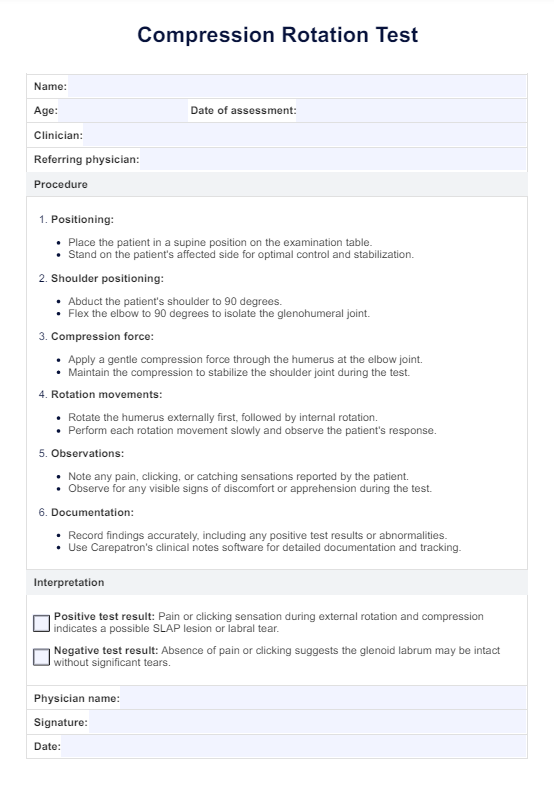
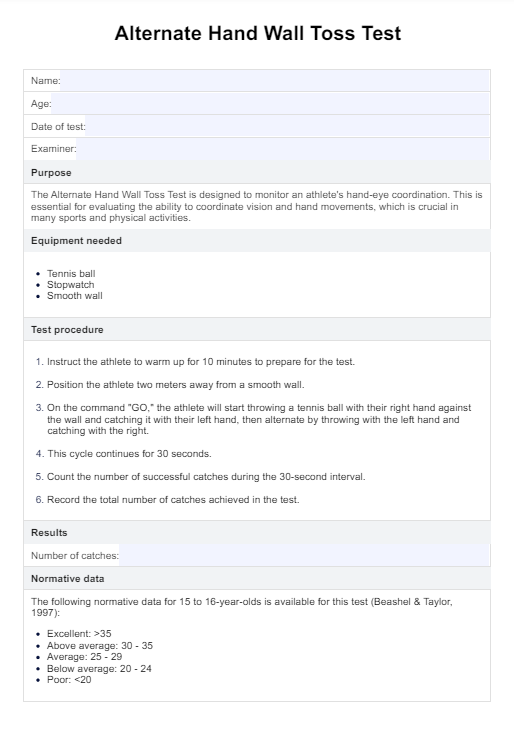
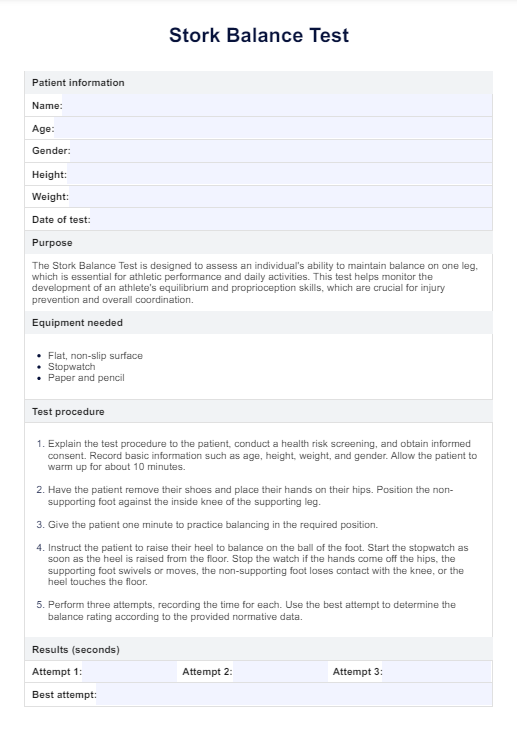
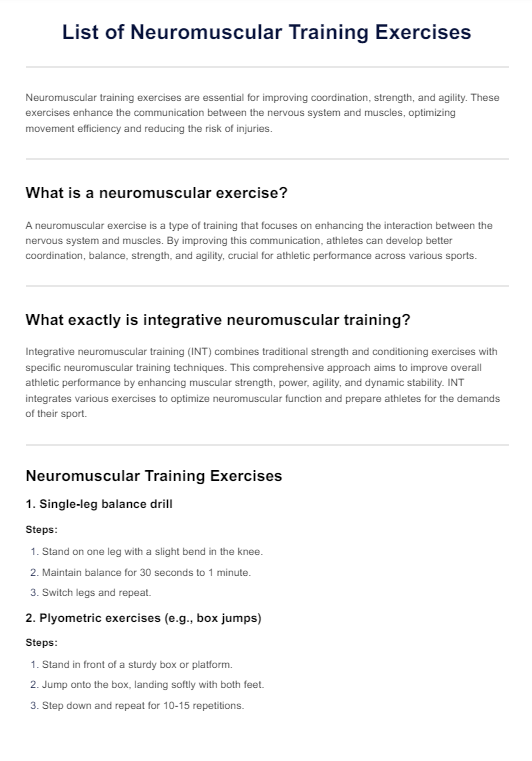
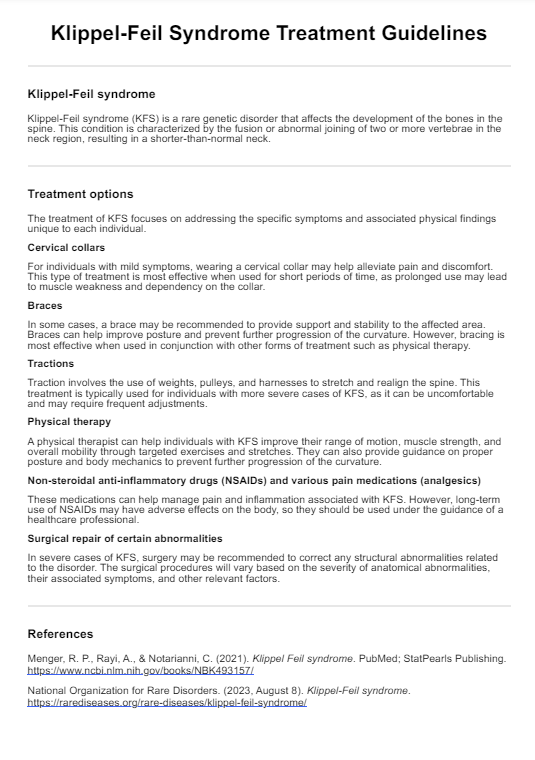
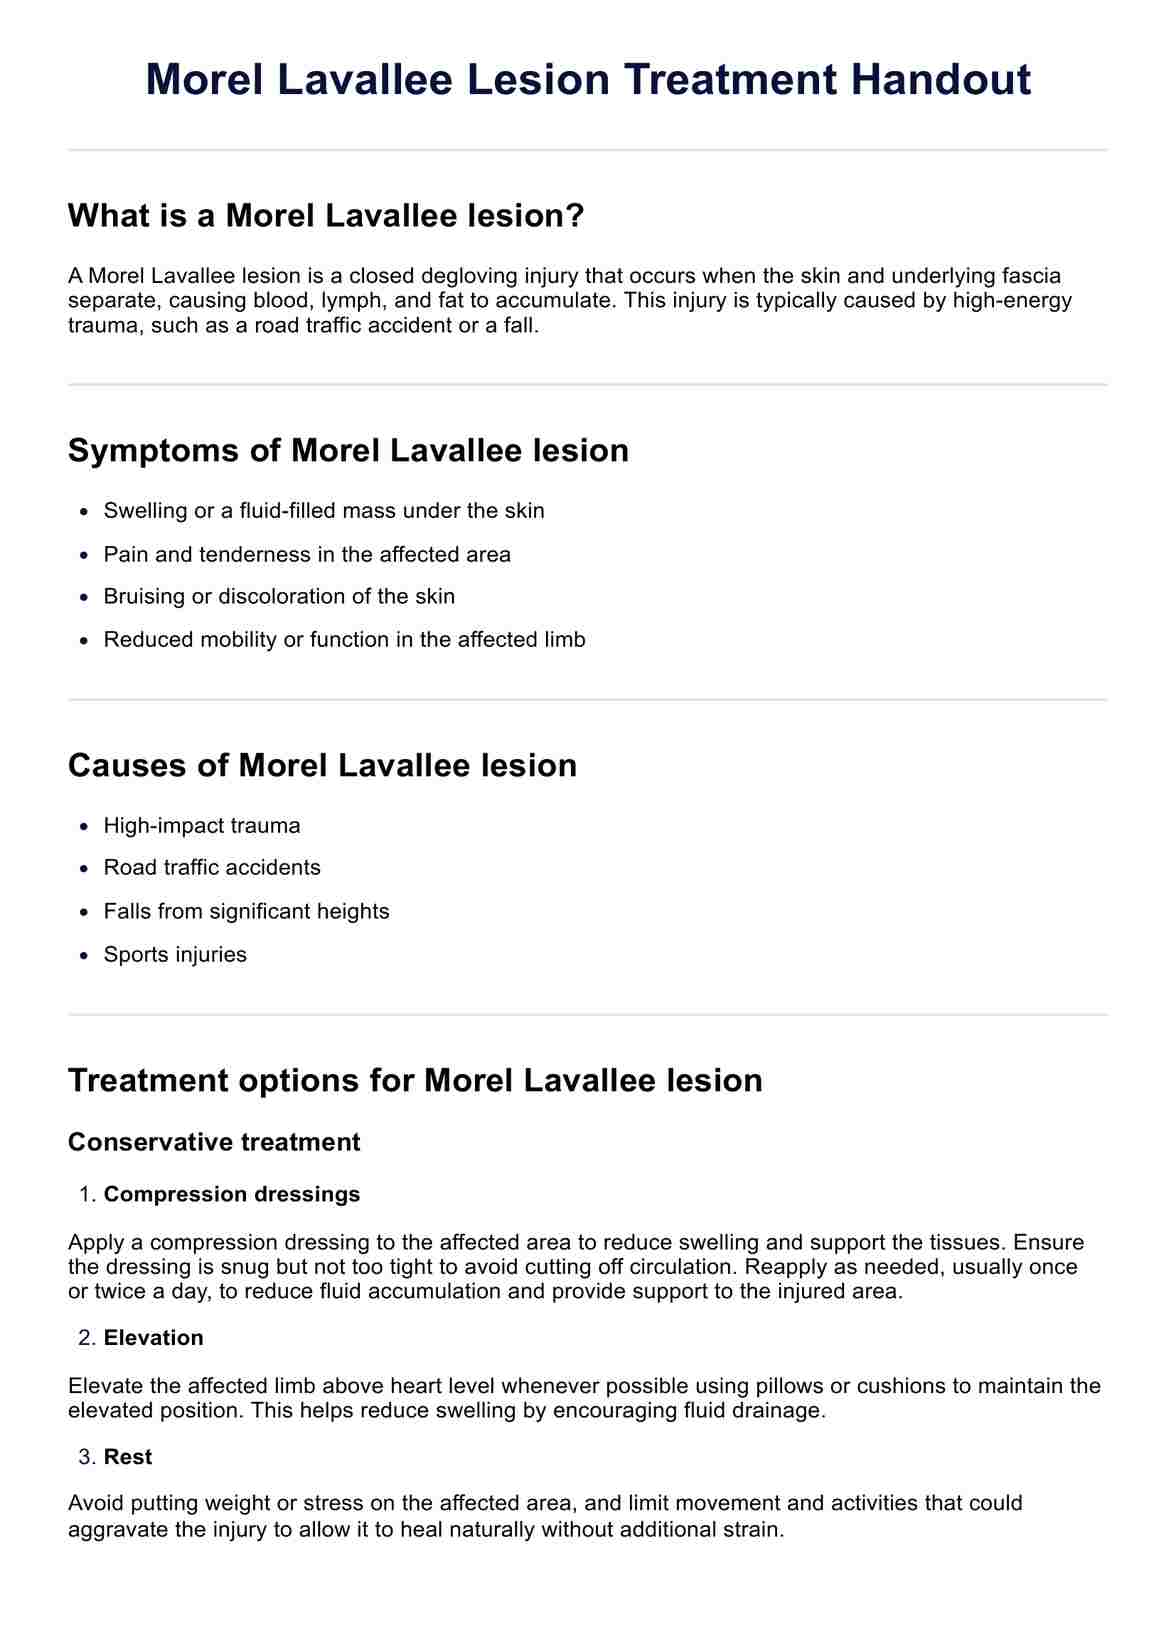
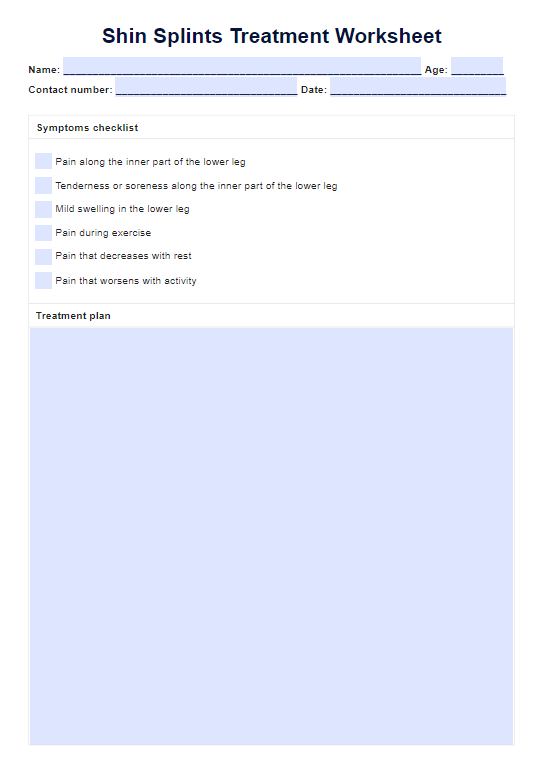
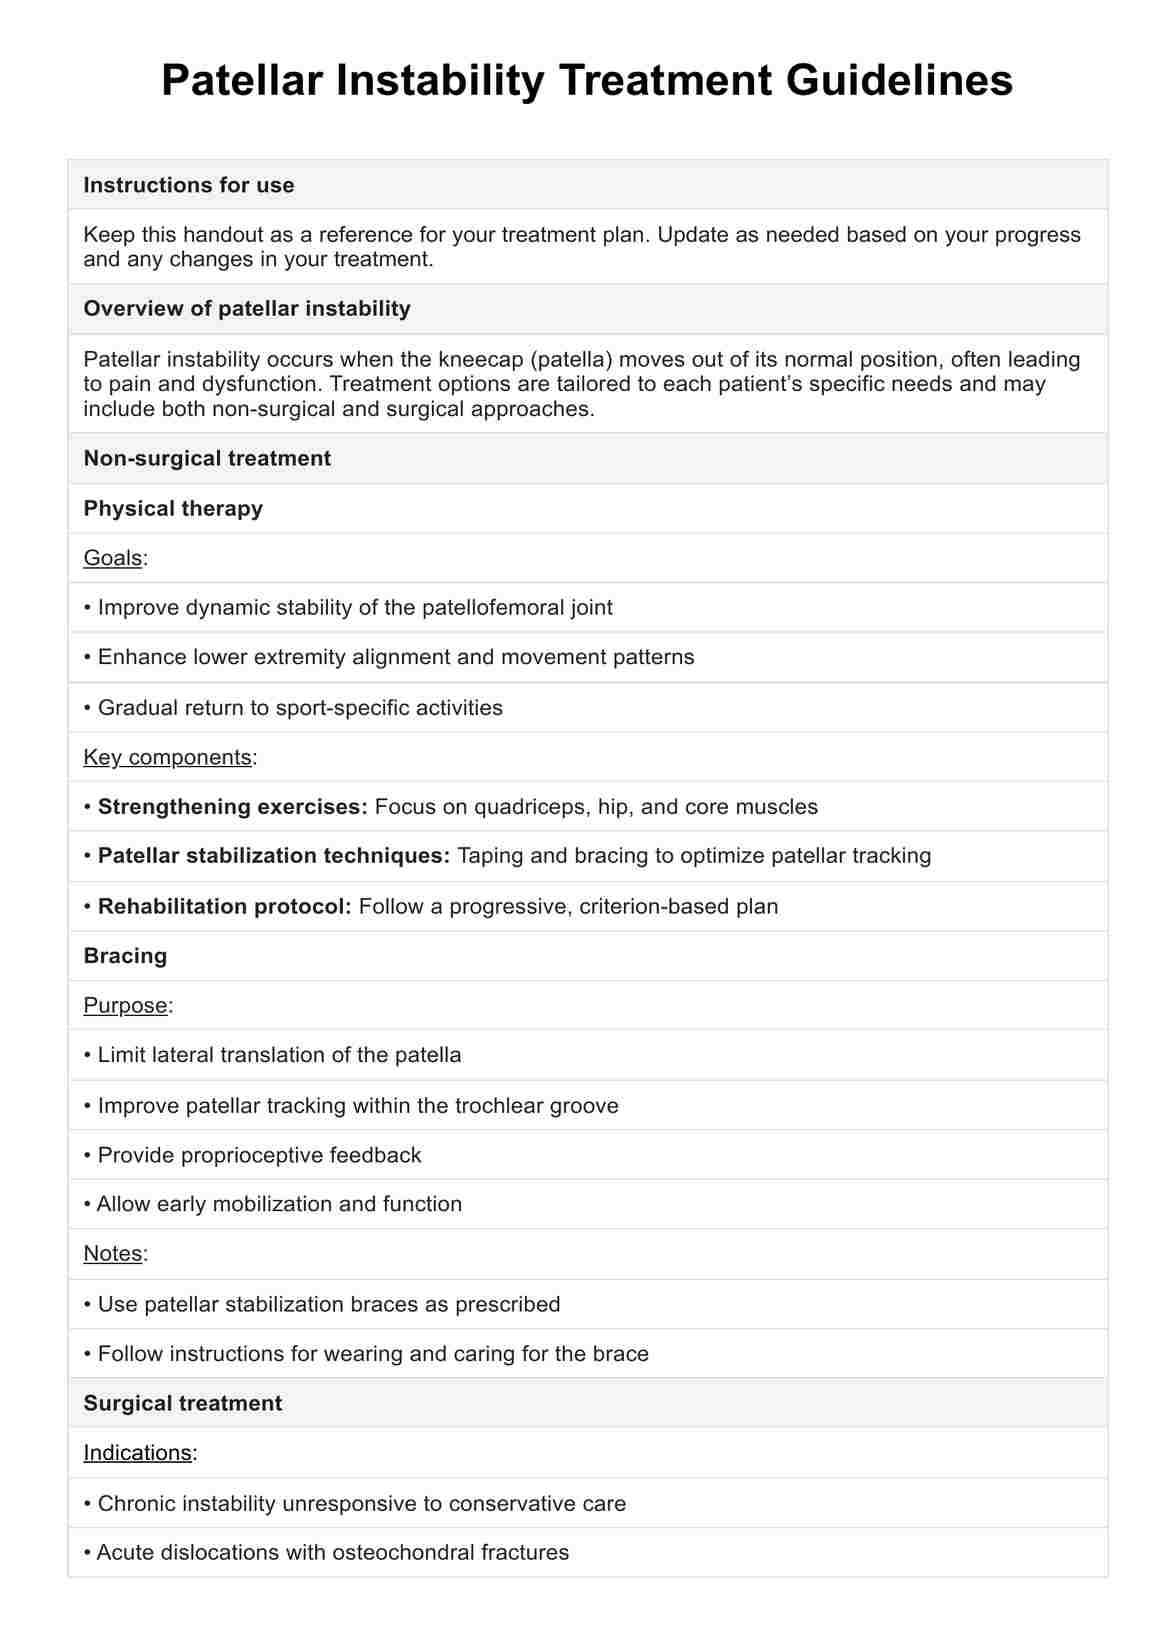
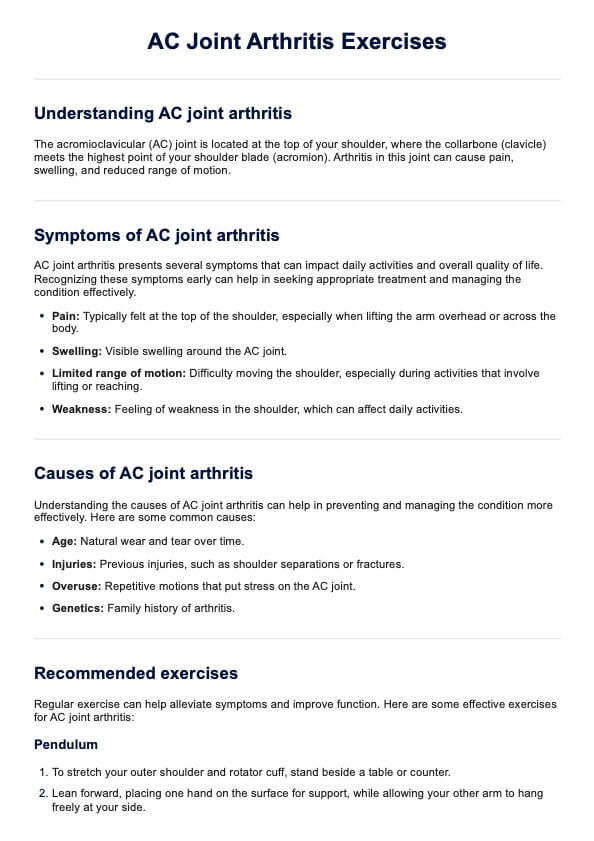
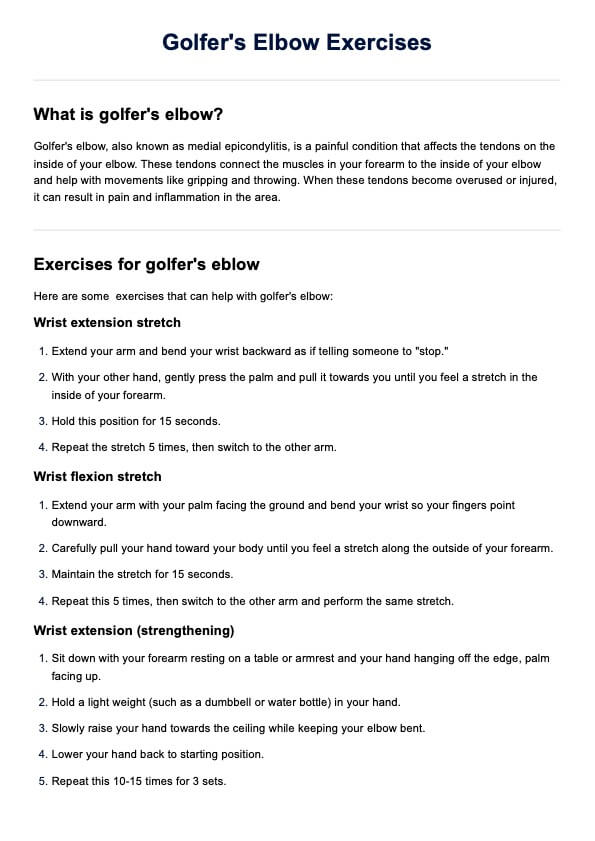
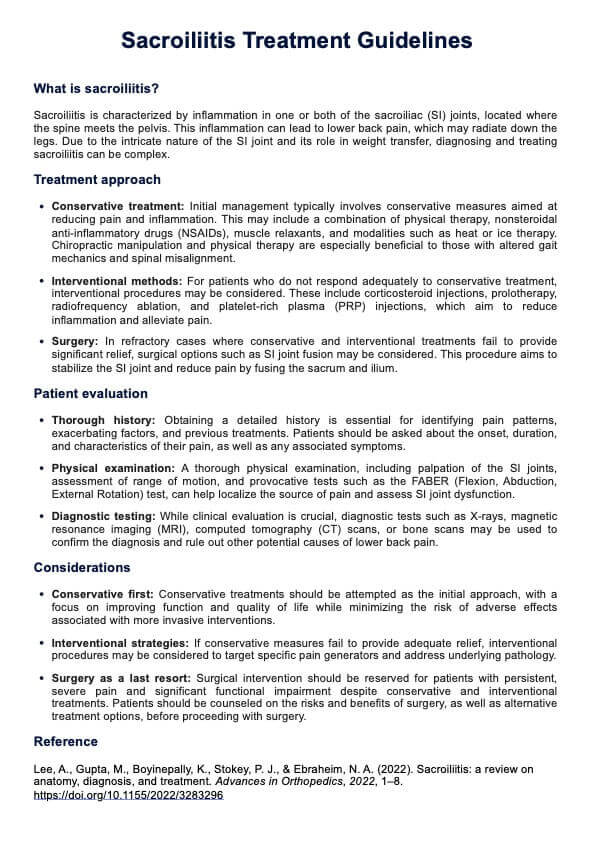
Normal Blood Pressure Chart
Discover what normal blood pressure looks like with our Normal Blood Pressure Chart. Learn to interpret readings and maintain heart health effectively.

Fact Checked by Ericka Pingol.


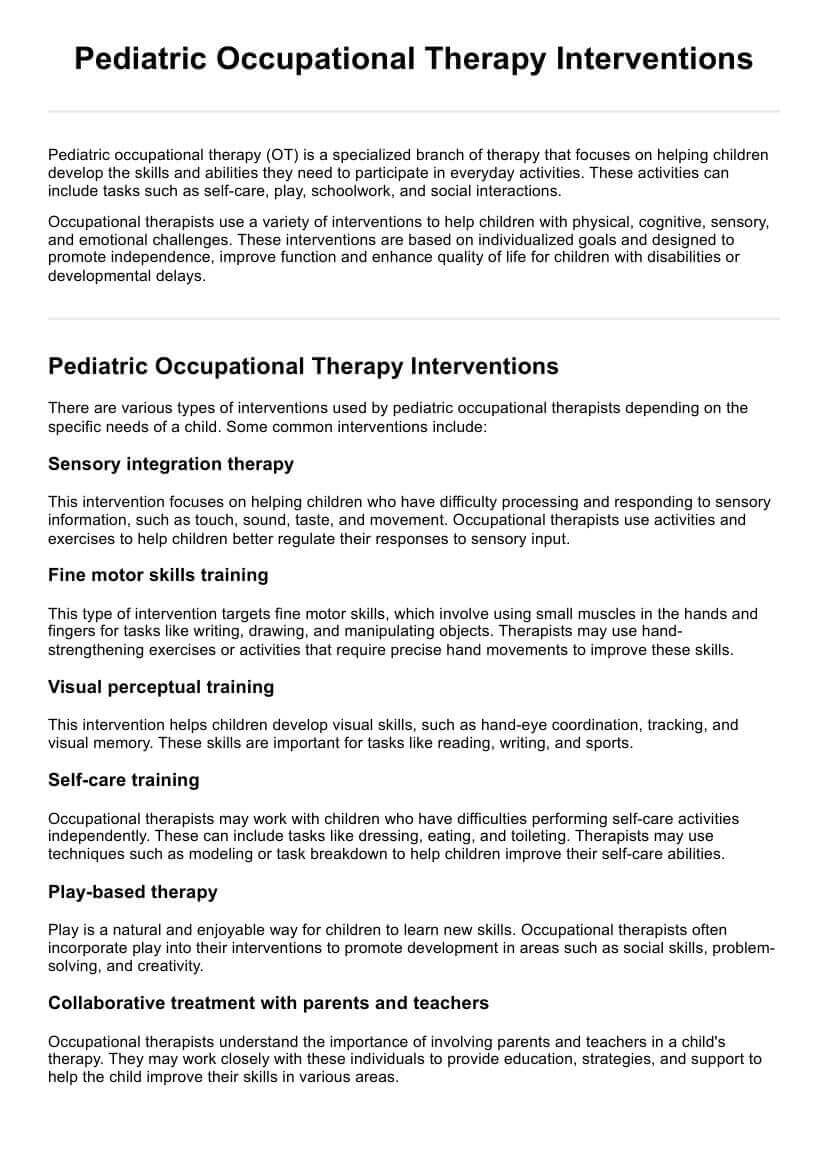
What is a Normal Blood Pressure Chart?
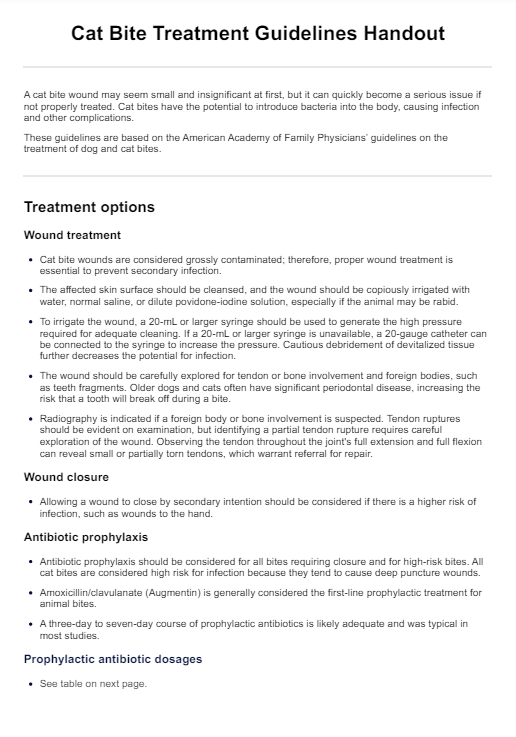
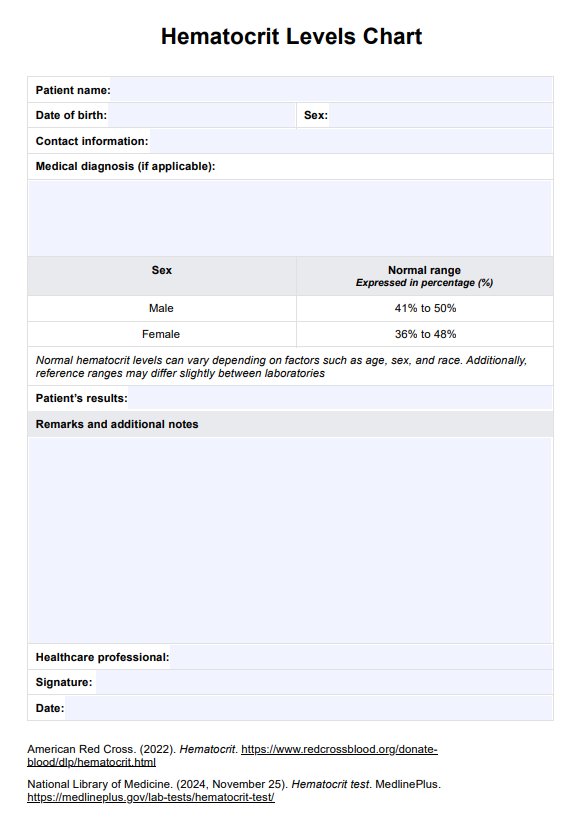
A standard blood pressure chart visually displays blood pressure values derived from measurements taken during a person's medical examination or at-home test. Blood pressure, measured in millimeters of mercury (mmHg), is shown as systolic pressure over diastolic blood pressure.
The initial value, systolic blood pressure, signifies the highest level reached when the heart beats, propelling blood against the artery walls. The second value, diastolic pressure, indicates the lowest level as the heart rests between beats. The standard blood pressure representation is in the systolic format over diastolic.
A normal or healthy blood pressure reading lies around 120/80 mmHg (Centers for Disease Control and Prevention, 2021). However, this average is influenced by age and the patient's current health status, emphasizing the need for healthcare professionals to consider various factors when interpreting results, as what may be regarded as normal for one individual could be problematic for another.
Are pulse rate and blood pressure the same?
Some individuals might confuse pulse rate with blood pressure due to their close association with cardiovascular health. However, they are not. Pulse rate, or heart rate, refers to the number of times the heart beats per minute. Resting heart rate typically ranges from 60 to 100 beats per minute but may fluctuate over short periods (British Heart Foundation, 2021). On the other hand, blood pressure measures the force of blood against the artery walls.
A pulse rate chart shows heartbeats over time, making spotting trends and unusual patterns easier. It's a helpful tool for keeping track of heart health and seeing how well treatments or lifestyle changes are working.
Check out our free Normal Blood Pressure Chart PDF here
Enhance your health with our free Normal Blood Pressure Chart
Understanding low blood and high blood pressure
Understanding low and high blood pressure is essential for maintaining overall health. It helps recognize potential risks and take appropriate measures to manage them effectively. Here are some of the basic things to know about each.
Low blood pressure
Low blood pressure, or hypotension, occurs when blood flows through blood vessels at pressures below the normal range, typically lower than 90/60 mm Hg. This condition poses a higher risk for symptoms like falling or fainting, particularly in older adults. Causes include blood loss from injury, dehydration, diabetes, heart issues such as irregular heartbeats, medications for conditions like high blood pressure or depression, and pregnancy (National Heart, Lung, and Blood Institute, 2022).
Here are some symptoms to look out for (Penn Medicine, 2019; National Heart, Lung, and Blood Institute, 2022):
- Dizziness
- Fainting
- Confusion
- Weakness
- Blurry vision
- Nausea
- Heart palpitations
Knowing about low blood pressure is as important as knowing about high blood pressure for staying healthy. It helps understand signs, risks, and what you can do to keep your patient's blood pressure in check.
High blood pressure
High blood pressure, or hypertension, is a common but potentially severe condition characterized by elevated pressure in the blood vessels (140/90 mmHg or higher), often without noticeable symptoms (World Health Organization, 2023).
Those with very high blood pressure may experience the following symptoms:
- Intense head pain
- Chest discomfort
- Feeling lightheaded
- Troubled breathing
- Nausea or vomiting
- Changes in vision
- Mental disorientation
- Irregular heartbeat
Making adjustments to your patient's lifestyle can reduce elevated blood pressure.
Hypertension stages
Blood pressure is split into five categories that help differentiate the severity of potential risks associated with increased blood pressure. Here are the five stages of hypertension (American Heart Association, 2023):
- Normal range: Blood pressure readings below 120/80 mm Hg are normal. Encourage maintaining heart-healthy habits like a balanced diet and regular exercise.
- Elevated: Blood pressure ranging from 120-129 systolic and less than 80 diastolic is elevated. Without intervention, there's a risk of progressing to hypertension.
- Hypertension stage 1: Blood pressure measures consistently range from 130 to 139 systolic or 80 to 89 mm Hg diastolic, placing the patient into hypertension Stage 1. Blood pressure medication and lifestyle changes are typically recommended based on the patient's risk of atherosclerotic cardiovascular disease to lower blood pressure.
- Hypertension stage 2: It occurs when blood pressure consistently reads 140/90 mm Hg or higher. At this stage, healthcare professionals are strongly encouraged to prescribe a combination of blood pressure medications and lifestyle changes.
- Hypertension crisis: If blood pressure goes over 180/120 mm Hg, it's a crisis requiring immediate medical attention. Repeat the test after five minutes; consult a healthcare professional if high values persist.
If the patient shows chest pain, back pain, shortness of breath, numbness, weakness, vision changes, or speech difficulty, it indicates organ damage. When blood pressure exceeds 180/120 mm Hg alongside these symptoms, immediate medical help is necessary.
How does it work?
Regular blood pressure monitoring is crucial for assessing cardiovascular health and preventing hypertension-related complications. To get started with helping your patients maintain normal or treat high blood pressure, follow these steps:
Step 1: Download the chart
Normal Blood Pressure Chart is an invaluable resource and essential to keep on hand. You can easily track and utilize this resource by clicking the download link on this page.
Step 2: Collate essential information
Complete all essential patient information, including any relevant medical history that may impact the parameters. Age and lifestyle factors such as smoking and exercise should also be indicated.
After conducting the blood pressure test, analyze the systolic pressure over the diastolic pressure against the recommended parameters to determine what category the patient falls under and if there is any change or need for intervention.
Step 3: Store the template securely
Once the results have been reviewed, secure the normal blood pressure chart so that access is only available to the relevant parties. As blood pressure is a commonly recorded result, medical practitioners and patients need easy access to the blood pressure chart.
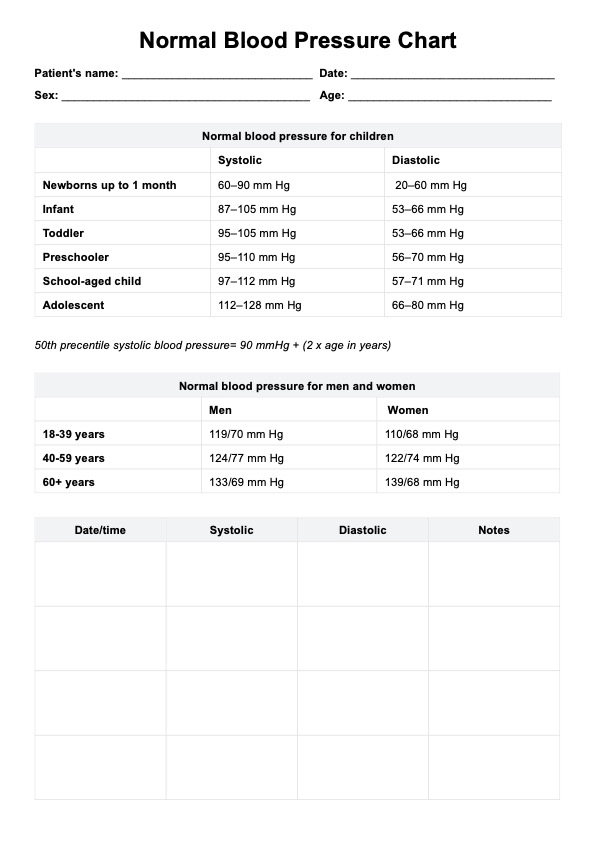
Normal Blood Pressure Chart example (sample)
Make the most of this essential recording tool by accessing a free, downloadable, and printable PDF of a completed Normal Blood Pressure Chart. We've designed this template with fictional values to help you effectively use the chart and interpret normal blood pressure ranges within your practice. This chart conveniently includes space for clinical notes and is an ongoing recording platform for practitioners and patients.
Note that healthy blood pressure levels may differ among institutions. Therefore, individuals should consult with their healthcare providers to receive personalized advice and ranges tailored to their specific health conditions and risk factors.
Download our free Normal Blood Pressure Chart PDF here:

When would you use this chart?
A Normal Blood Pressure Chart is a well-utilized tool used in a variety of healthcare settings by both medical practitioners and patients for various reasons, some of which are outlined below:
Medical check-ups
Medical professionals may utilize a blood pressure chart during routine screenings and check-ups to assess the individual's cardiovascular health. This easy tool is a valuable way of finding underlying issues such as hyper or hypotension and leads to further diagnosis should the patient display abnormal results for their appropriate age parameters.
Routine health checks and monitoring
With an accessible and easy-to-use automated blood pressure monitor, blood pressure charts can be carried out at home once the patient has been educated on how to take and record their blood pressure measurements. This is a common practice and is encouraged for patients with hypertension or those at risk of developing high blood pressure.
Preventative care
Continuous and regular charting of an individual's blood pressure measurement is a fantastic preventative measure to help identify the need for change before life-threatening conditions such as heart disease or strokes become a reality.
Diagnosis and treatment
Blood pressure charts are crucial in diagnosing and managing conditions like hypertension. They can help determine an appropriate treatment plan, and medical professionals can record and access the measurements to monitor the effectiveness of any prescribed intervention.
Research
Blood pressure measurements are well utilized in clinical studies to analyze and predict trends in blood pressure levels across different populations. This information is invaluable in identifying risk factor groups and helps dictate who should receive regular blood pressure tests to decrease the risk of hypertension.
Fitness and well-being
Well-being and fitness programs may use a blood pressure chart to monitor the impact of specific diet and lifestyle changes on cardiovascular health.
Why use Carepatron as your practice management software?
Selecting Carepatron as your preferred software for normal blood pressure charting and hypertension identification brings numerous advantages for healthcare practitioners.
Carepatron provides a centralized workspace that efficiently manages clinical documentation and electronic patient records. It enables you to set reminders for patient appointments and handle medical billing seamlessly, all while navigating within a single platform. This eliminates the need for additional software downloads, offering an integrated and comprehensive approach that simplifies normal blood pressure charting and various other tasks.
We are committed to delivering an efficient and productive platform for healthcare professionals, so Carepatron has created customizable workflows and tools to cater to individual needs. Carepatron empowers practitioners and patients to confidently handle administrative tasks such as service bookings and clinical note collation. Our portable medical dictation software simplifies clinical note-taking, ensuring an effortless process.
We prioritize the security of all notes, clinical records, results, and practitioner data by adhering to global security requirements, including HIPAA, GDPR, and HITRUST. Try it now for free!
.png)
References
American Heart Association. (2023, May 30). Understanding blood pressure readings. American Heart Association. https://www.heart.org/en/health-topics/high-blood-pressure/understanding-blood-pressure-readings
British Heart Foundation. (2021, May 27). What is a normal pulse rate? https://www.bhf.org.uk/informationsupport/heart-matters-magazine/medical/ask-the-experts/pulse-rate
Centers for Disease Control and Prevention. (2021, May 18). High blood pressure symptoms and causes. Centers for Disease Control and Prevention. https://www.cdc.gov/bloodpressure/about.htm
National Heart, Lung, and Blood Institute. (2022, March 24). Low blood pressure. https://www.nhlbi.nih.gov/health/low-blood-pressure
Penn Medicine. (2019). Low blood pressure. https://www.pennmedicine.org/for-patients-and-visitors/patient-information/conditions-treated-a-to-z/low-blood-pressure
World Health Organization. (2023, March 16). Hypertension. https://www.who.int/news-room/fact-sheets/detail/hypertension
Commonly asked questions
Healthcare professionals like physicians often request blood pressure charts to track and diagnose cardiovascular health concerns. Individuals may also use this chart to record their blood pressure measures for monitoring.
It is used in various contexts to monitor and assess blood pressure levels. Both practitioners and patients can utilize them.
It is a visual tool for tracking and interpreting blood pressure readings gathered through a sphygmomanometer or automated blood pressure monitor over time.
A single measurement takes minutes to complete, and recording it into a blood pressure chart takes around a minute.
Related Templates

Popular Templates