Phonological Processes Chart
Discover how a Phonological Processes Chart aids in diagnosing and treating speech sound disorders, and learn why Carepatron is the ideal software for speech therapists.


What are phonological processes?
Phonological processes are patterns of sound errors that typically developing children use to simplify speech as they learn to talk. These processes are a normal part of speech development and are generally eliminated as children grow older, and their speech skills mature. They involve systematic substitutions, deletions, or additions of sounds to syllables or sound patterns and are used to make words easier to pronounce.
At what age are phonological processes eliminated?
Most phonological processes are eliminated when a child reaches 3 to 4 years old. However, some processes can persist until the child is 6 to 7 years old. For example, processes like final consonant deletion and reduplication are usually gone for most children by age 3. In contrast, processes like gliding and stopping of fricatives may persist until most children are age 5 or older.
If these processes continue beyond the expected age of elimination, it may indicate a phonological disorder that requires intervention from a speech-language pathologist.
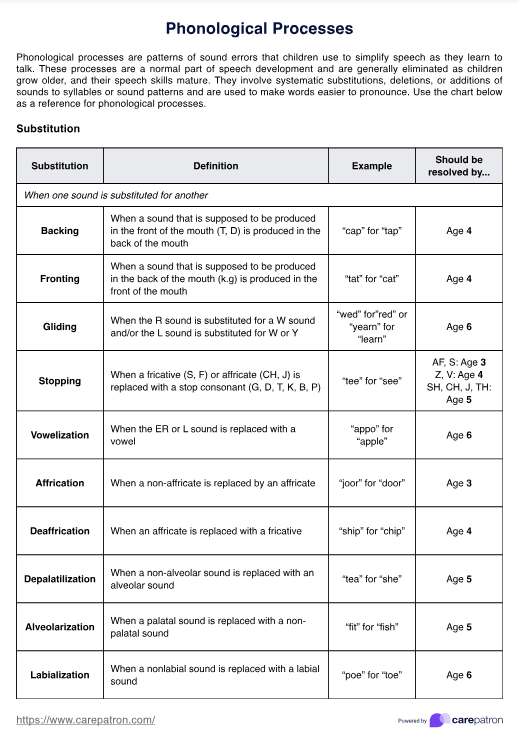
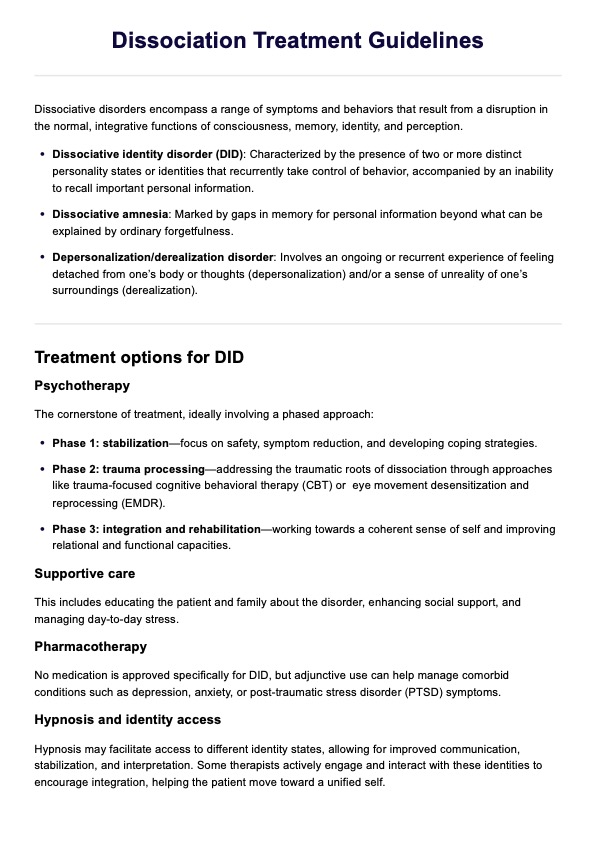
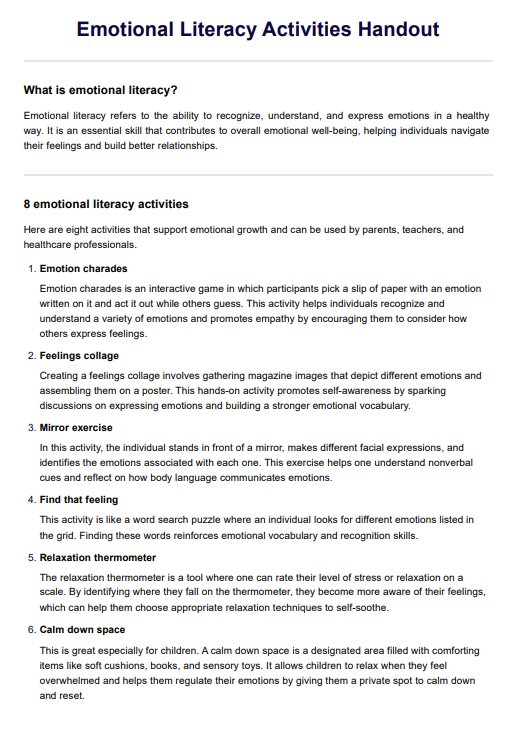
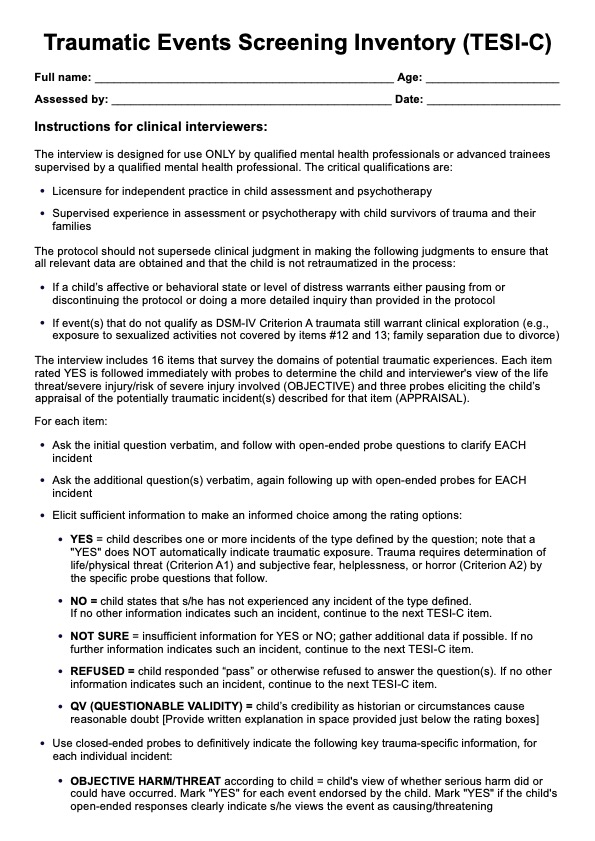
Phonological Processes Chart Template
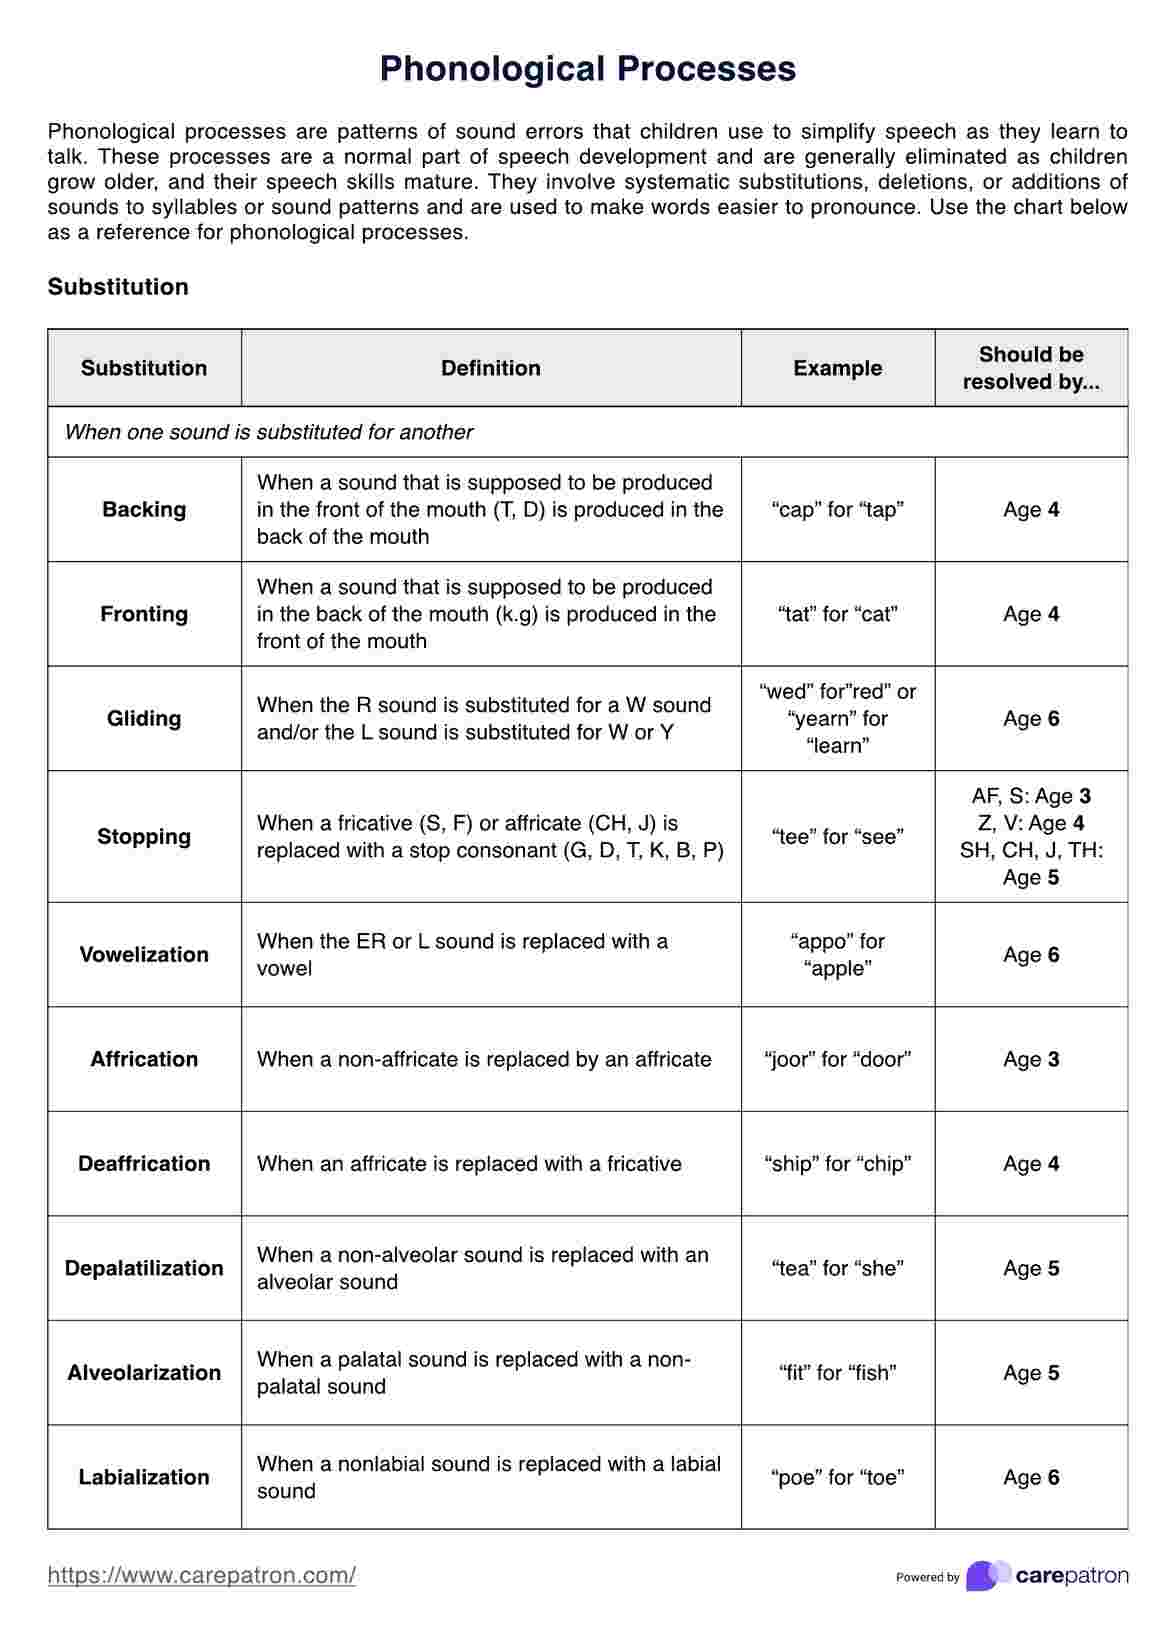
Phonological Processes Chart Example
Types of phonological processes
Phonological processes can be categorized into several types based on the nature of the simplifications they involve. Understanding these categories helps in identifying and addressing issues with speech sounds and speech sound disorders in children.
Substitution processes
These processes involve substituting one sound for another. Examples include:
- Fronting: The child replaces sounds that should be made at the back of the mouth (like /k/ and /g/) with sounds made at the front (like /t/ and /d/). For instance, "car" becomes "tar."
- Backing: Opposite to fronting, the child replaces sounds that should be made at the front of the mouth with those made at the back. For example, "dog" becomes "gog."
- Gliding: The child replaces the liquid sounds /l/ and /r/ with the glides /w/ and /j/. For instance, "rabbit" becomes "wabbit."
Assimilation processes
These processes occur when one sound in a word becomes similar to another sound in the same word. Examples include:
- Velar assimilation: A non-velar sound changes to a velar sound due to the influence of a velar sound elsewhere in the word. For instance, "dog" becomes "gog."
- Nasal assimilation: A non-nasal sound changes to a nasal sound because of a nasal sound in the word. For example, "candy" becomes "nanny."
Syllable structure processes
These processes involve changes to the structure of syllables in words and other sounds. Examples include:
- Cluster reduction: A consonant cluster is simplified by deleting one or more consonants. For example, "stop" becomes "top."
- Final consonant deletion: The final consonant in a word is omitted. For instance, "cat" becomes "ca."
- Initial consonant deletion: The initial consonant in a word is omitted. For example, "cup" becomes "up".
- Weak syllable deletion: An unstressed or weak syllable in a word is omitted. For example, "banana" becomes "nana".
- Reduplication: A syllable in a word is repeated. For example, "bottle" becomes "baba."
How does our Phonological Processes Chart work?
Our Phonological Processes Chart is designed to help speech-language pathologists (SLPs) and other healthcare professionals identify and address speech and consonant sound disorders in children. By understanding and documenting the phonological processes and the sound produced by a child, professionals can create targeted intervention strategies to improve speech sounds, clarity and communication skills.
Step 1: Understand the phonological processes
Familiarize yourself with the different phonological processes listed in the chart. These phonological delays include substitution processes (e.g., fronting, backing), assimilation processes (e.g., velar assimilation, nasal assimilation), and syllable structure processes (e.g., cluster reduction, final consonant deletion).
Step 2: Observe and record speech samples
Listen to the child's spontaneous speech or have them repeat a set of standard words and phrases. Pay close attention to the phonological patterns and errors in their speech. Document specific examples that illustrate the use of different phonological processes.
Step 3: Compare to age-appropriate norms
Use the chart to compare the phonological error patterns of a child's speech patterns with age-appropriate norms. The chart indicates the typical age by which each phonological process should be resolved. This helps determine whether the child's speech errors are developmentally appropriate or indicate a speech disorder.
Step 4: Analyze and identify target areas
Identify which phonological processes persist beyond the expected age of resolution. These are the areas that will need focused intervention. Prioritize processes that significantly impact intelligibility and those the child is ready to address.
Step 5: Develop a treatment plan
Based on the analysis, create a treatment plan with specific goals and activities to address the targeted phonological processes. Incorporate exercises that promote the development of correct speech sound production and monitor progress regularly to adjust the speech therapy plan as needed.
Benefits of using this chart
Using a Phonological Processes Chart can significantly enhance speech-language pathologists' assessment and treatment of phonological processes. Here are three key benefits:
Enhanced diagnostic accuracy
A Phonological Processes Chart helps clinicians accurately identify and categorize speech sound errors. By providing a clear framework for recognizing patterns of errors in consonant sounds, the chart aids in diagnosing specific phonological disorders. This precision ensures that children receive the most appropriate and effective interventions for their speech development needs.
Streamlined treatment planning
The chart offers a systematic approach to tracking progress and planning treatment. It enables therapists to set specific, measurable goals based on a child's phonological processes. This structured method facilitates targeted interventions, making the treatment process more efficient and effective.
Improved communication with parents
Using the chart to explain a child’s speech sound errors to parents enhances understanding and involvement in the treatment process. It provides a visual and easily understandable way to demonstrate progress and the rationale behind specific therapeutic strategies, fostering collaboration between therapists and families.
Commonly asked questions
Phonological processes are patterns of sound errors that children use to simplify speech as they learn to talk. These phonological patterns are typical in early speech and language development but should be outgrown as the child matures.
Most phonological processes are eliminated by 3 to 4 years, although some, like gliding and stopping, may persist until age 6 or 7. Persistent processes beyond these ages may indicate a phonological disorder.
A Phonological Processes Chart helps speech-language pathologists identify, categorize, and track speech sound errors. It aids in accurate diagnosis, streamlined treatment planning, and improved communication with parents and family members.






-template.jpg)
