Hormone Cycle Chart
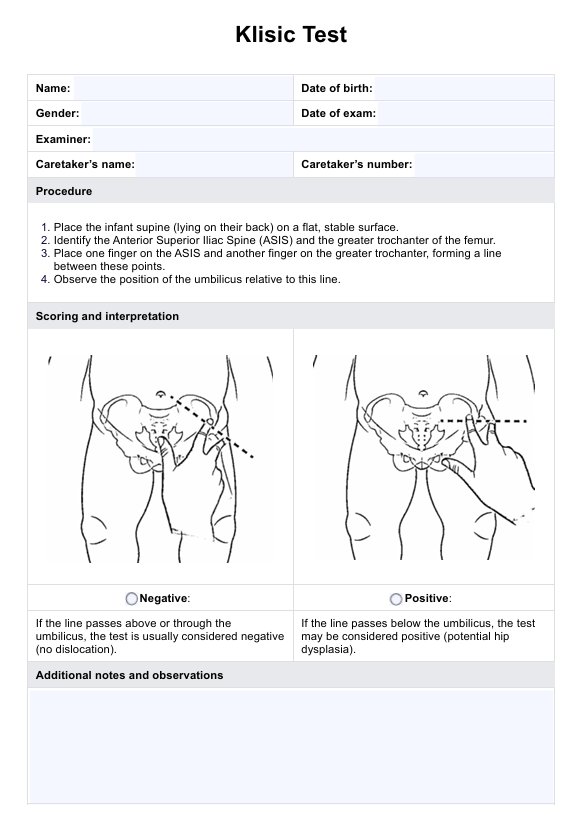
Discover your body's rhythms with our Hormone Cycle Chart – track, manage, and understand hormonal changes effortlessly. Download your free chart now!
.jpg)
Fact Checked by Ericka Pingol.


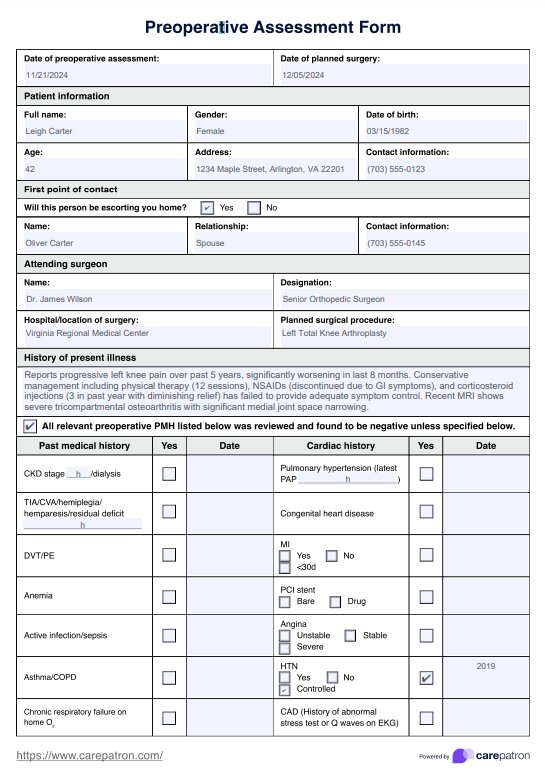
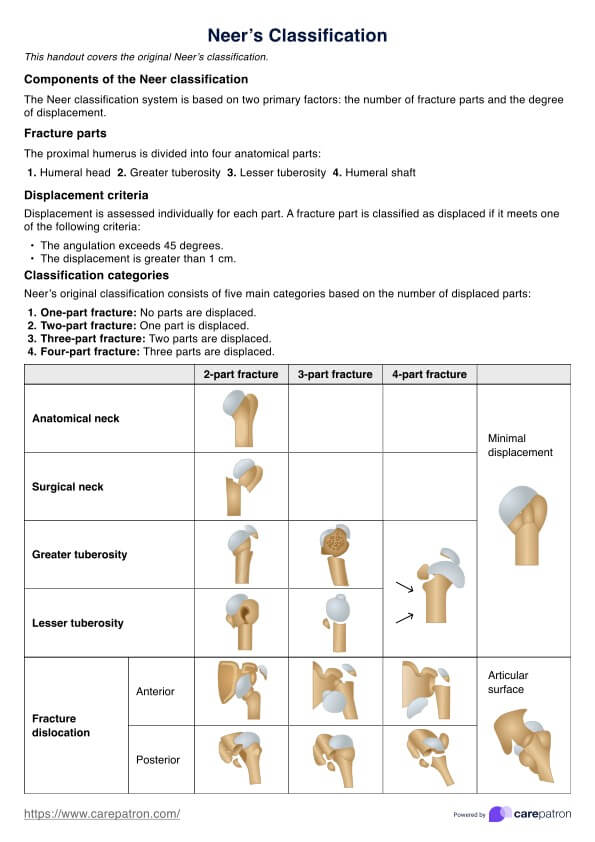
What is a Hormone Cycle Chart?
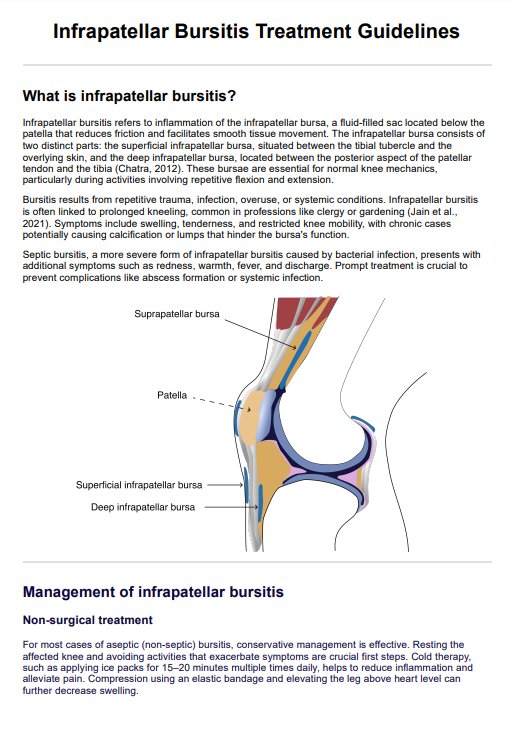
A Hormone Cycle Chart is a detailed graphical representation that maps out the intricate dance of hormones throughout the human menstrual cycle. It is a crucial educational and diagnostic tool, providing insights into the ebb and flow of hormones that orchestrate the menstrual cycle's various stages. By plotting the levels of estrogen, progesterone, follicle-stimulating hormone (FSH), and luteinizing hormone (LH), the chart offers a window into the body's endocrine system and its role in reproductive health.
The Hormone Cycles Chart breaks down the menstrual cycle into different milestones:
- Menstrual phase: This happens on days 1-5. Hormone levels are at their lowest, marking the shedding of the uterine lining (menstrual blood). This basically the menstrual period.
- Follicular phase: This overlaps with the menstrual phase, happening on days 1-13. This is when the pituitary gland starts to produce follicle stimulating hormone, stimulating ovarian follicle development. One follicle will become larger than the others; the dominant follicle grows, producing estrogen and LH as it turns into an egg and thickening the uterine lining.
- Ovulation: A surge in LH triggers the release of an egg from the ovary, with estrogen peaking just before ovulation. This usually happens on day 14.
- Luteal phase: This phase, on days 15-28 is when the female body gears up for the possibility of pregnancy. The egg turns into a corpus luteum that starts to produce progesterone and estrogen.
- Post-ovulation: This happens in the late luteal phase if there is no fertilized egg. The estrogen and progesterone levels start going since the body is not pregnant. The uterine lining breaks down into menstrual blood, the follicles start maturing, and the menstrual cycle begins all over.
Understanding these hormonal patterns is vital for individuals tracking fertility, managing symptoms of hormonal imbalance, or seeking to understand their reproductive health better. For healthcare professionals, the chart is indispensable for diagnosing conditions like PCOS, PMS, or potential fertility issues. It can also guide the management of hormonal therapies and contraceptive choices.
Typically, the menstrual cycle occurs over 28 days, so this printable chart illustrates the standard 28-day cycle for simplicity. However, it's imperative to remember that uterine and ovarian cycles exhibit substantial variability between individuals. While some may adhere to a regular 28-day rhythm, menstrual cycles vary, and others may experience processes that are notably longer, shorter, or less uniform (Ernst & Watson, 2023).
A Hormone Cycle Chart is more than just a diagram; it's a narrative of a person's reproductive story, providing clues to their overall well-being and offering a foundation for informed health decisions.
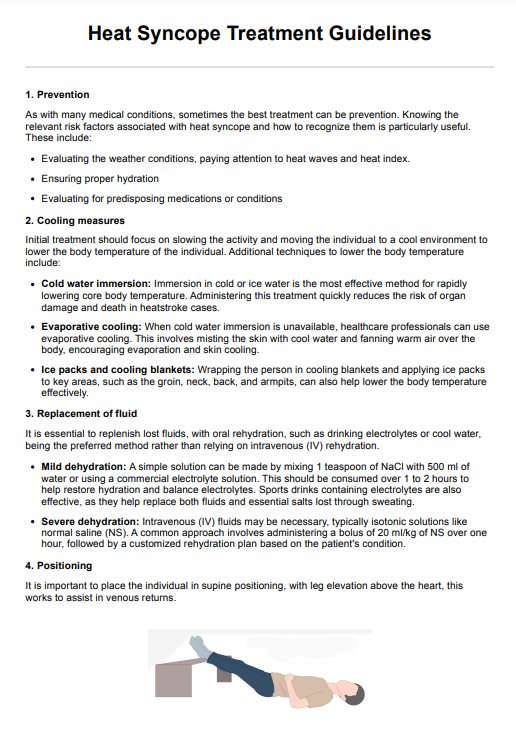
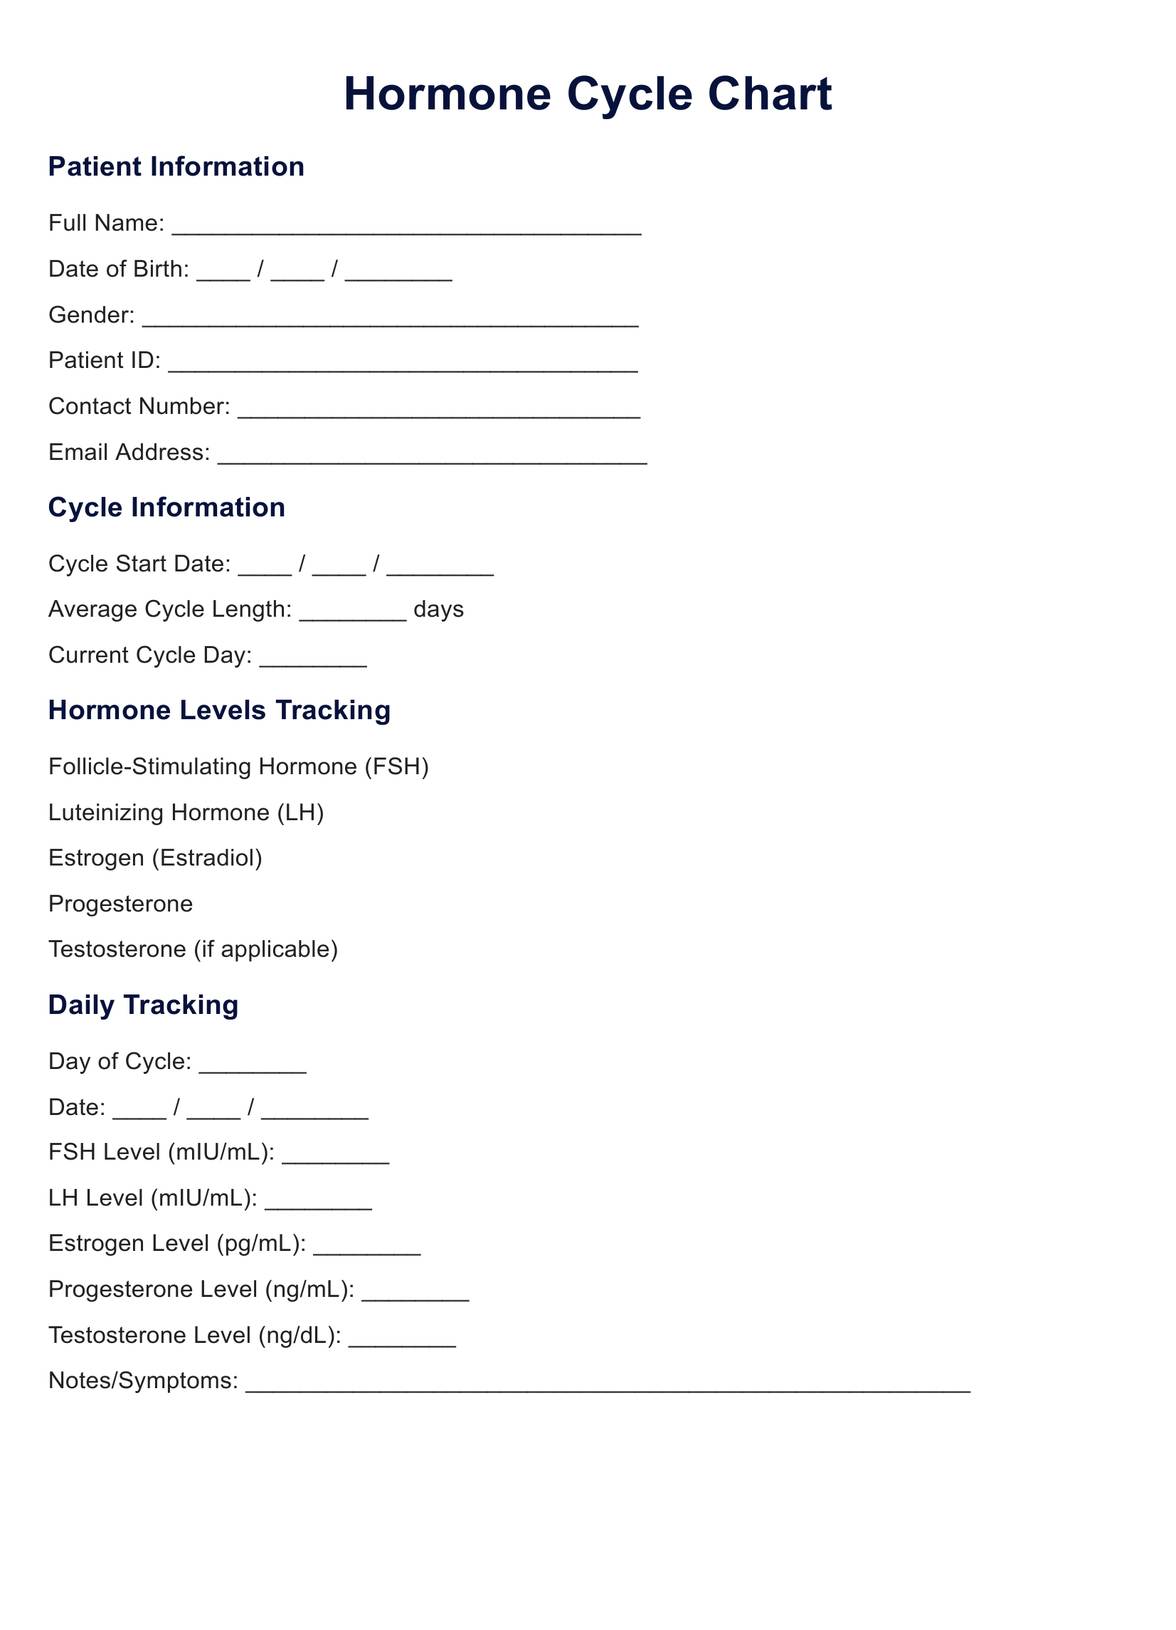
Hormone Cycle Chart Template
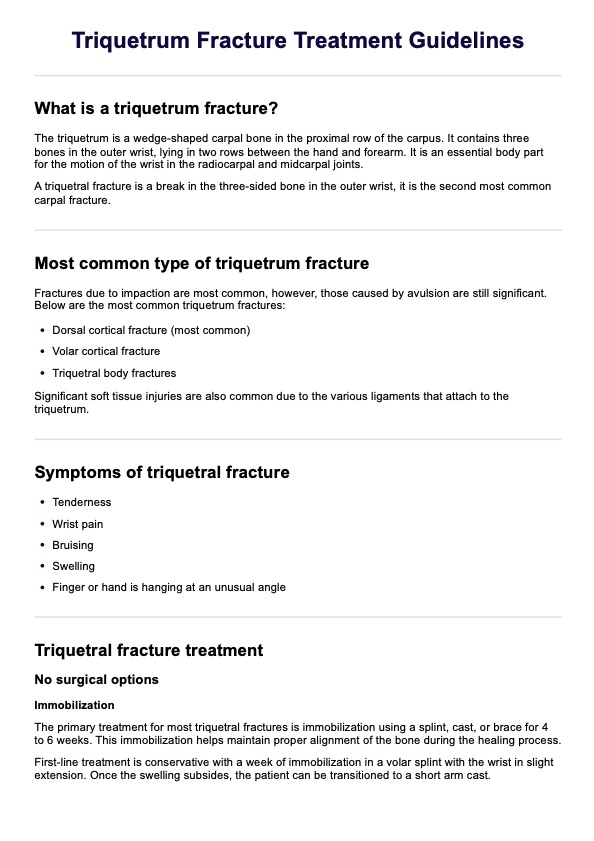
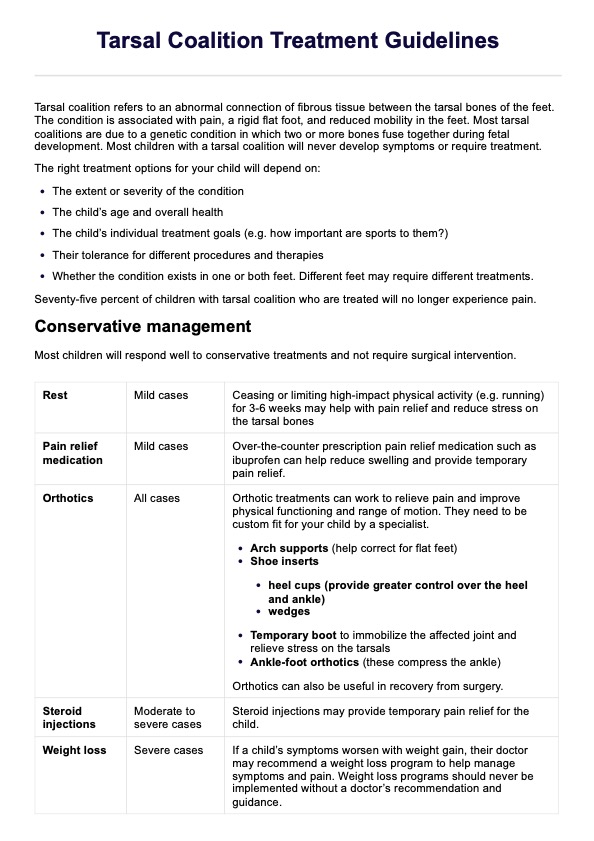
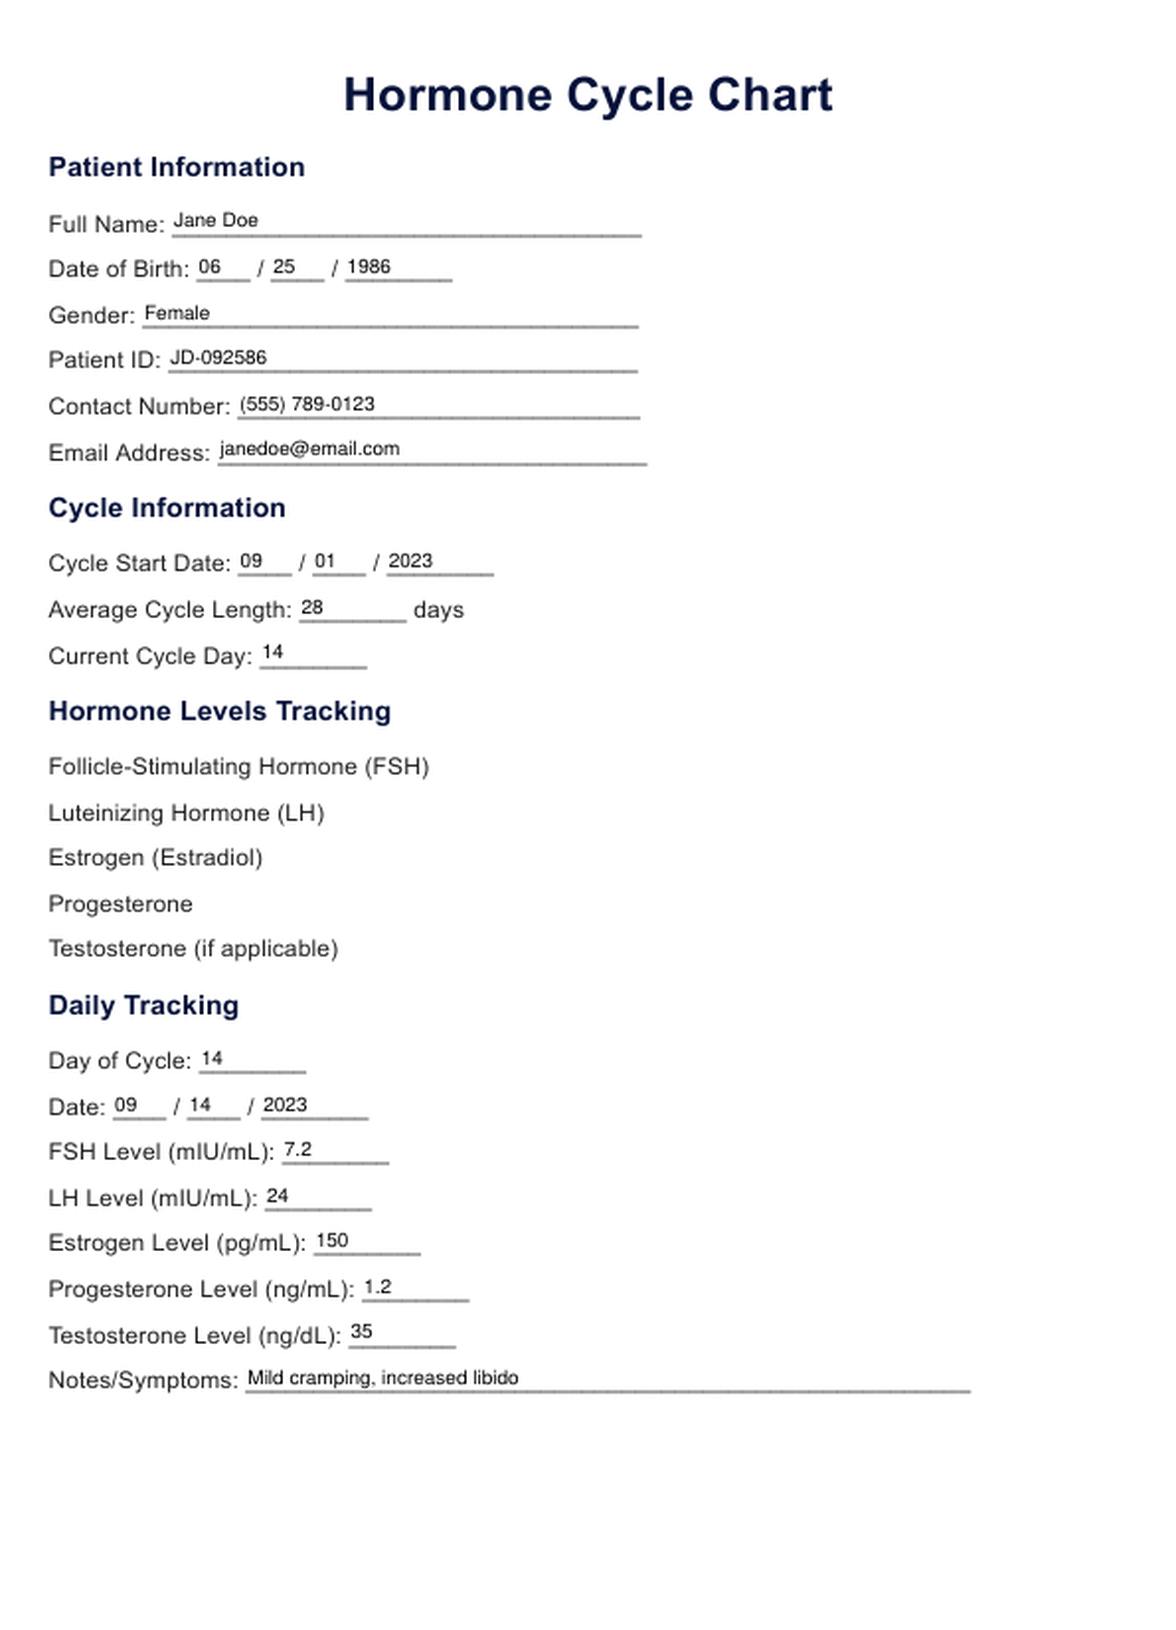
Hormone Cycle Chart Example
How does a Hormone Cycles Chart work?
Our template contains three graphs. The first chart displays the normative trend of hormone levels for most women throughout the menstrual cycle. The other 2 charts displays gonadotropic hormone levels (specifically FH and LSH) and ovarian hormone concentrations (encompassing estradiol, inhibin, and progesterone).
Our template includes a daily tracker where users can write down their hormone levels. The tracker can be used to log estrogen, progesterone, follicle-stimulating hormone (FSH), and luteinizing hormone (LH) levels on a daily basis, with extra rows for women with more irregular cycles.
When would you use this chart?
A Hormone Cycle Chart is a versatile tool employed in several contexts:
Personal health monitoring
Individuals use this chart to track their entire menstrual cycle, noting patterns or irregularities. It's particularly useful for those experiencing symptoms like irregular periods, heavy bleeding, or premenstrual syndrome (PMS) (Dalton, 1964) and for those monitoring their cycle for natural family planning.
Fertility planning
Couples trying to conceive may use the chart to identify the most fertile days (Fehring et al., 2006) and to improve the chances of conceiving. Conversely, it can also aid in natural contraception methods by indicating less fertile periods.
Healthcare diagnosis and treatment
Medical professionals utilize hormone cycle charts to diagnose conditions like polycystic ovary syndrome (PCOS), endometriosis (Azziz et al., 2004), or early menopause. It aids in understanding the patient's cycle and tailoring treatments for hormonal imbalances.
Wellness and lifestyle adjustments
The chart can guide individuals to adapt their exercise, diet, and stress management techniques according to the different phases of their cycle to optimize well-being.
Research and education
Researchers and students studying the effects of the menstrual cycle on various health conditions, such as migraine patterns or mood disorders, use these charts for data collection and analysis. They are also valuable educational resources for teaching patients about reproductive health.

What do the results mean?
If the hormone levels of the user roughly match the plotted chart of normal normal menstrual cycle hormone levels, it suggests that their levels are within the typical range. However, if the user's hormones do not match, it may indicate potential issues such as premenstrual dysphoric disorder (PMDD), polycystic ovary syndrome (PCOS), thyroid disorders, or perimenopause. In such cases, further investigation and consultation with a healthcare provider are recommended.
References
Azziz, R., Woods, K. S., Reyna, R., Key, T. J., Knochenhauer, E. S., & Yildiz, B. O. (2004). The prevalence and features of the polycystic ovary syndrome in an unselected population. The Journal of Clinical Endocrinology & Metabolism, 89(6), 2745-2749. https://academic.oup.com/jcem/article/89/6/2745/2870315?login=false
Dalton, K. (1964). The premenstrual syndrome. Springfield, IL: Charles C. Thomas Publisher.
Ernst, H., & Watson, S. (2023). Stages of menstrual cycle: menstruation, ovulation, hormones, mor. Healthline. https://www.healthline.com/health/womens-health/stages-of-menstrual-cycle
Fehring, R. J., Schneider, M., & Raviele, K. (2006). Variability in the phases of the menstrual cycle. Journal of Obstetric, Gynecologic & Neonatal Nursing, 35(3), 376-384. https://www.jognn.org/article/S0884-2175(15)34376-8/abstract
Commonly asked questions
The four hormone cycles are the menstrual phase, follicular phase, ovulation phase, and luteal phase.
The most hormonal time of the cycle is typically around ovulation when estrogen levels peak, triggering the release of an egg from the ovary.
You can determine your phase by tracking your menstrual cycle's length and symptoms, such as changes in cervical mucus, basal body temperature, and hormonal levels.
Related Templates

Popular Templates