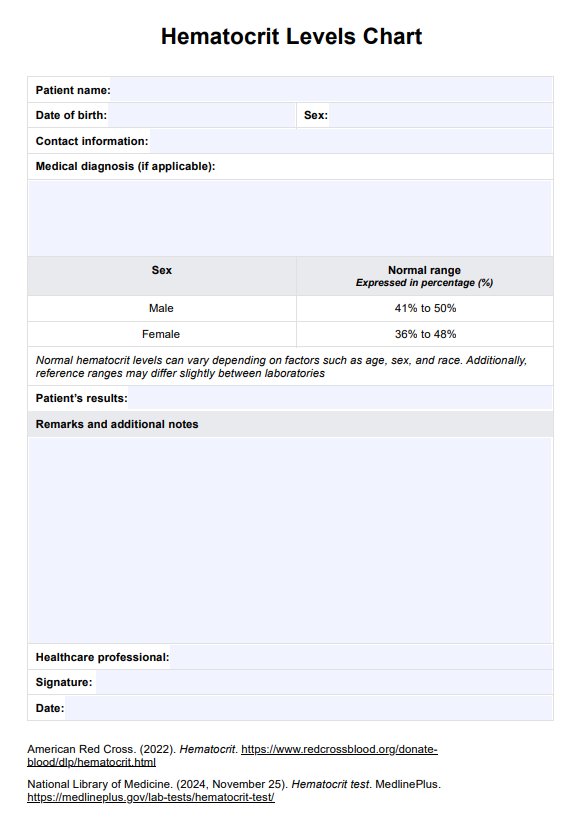
What is a hematocrit test?

A hematocrit test, often called an HCT, is a common blood test that measures the percentage of red blood cells (RBCs) in a person's blood. It is a vital component of a complete blood count (CBC), a standard diagnostic test performed for various medical purposes, including routine check-ups, disease diagnosis, and monitoring the progress of certain medical conditions.

This test provides valuable information about a person's blood's overall health and oxygen-carrying capacity. The bone marrow produces red and white blood cells. Hemoglobin, proteins in red blood cells, carry oxygen from the lungs to various tissues and organs throughout the body. Therefore, the hematocrit level reflects the blood's ability to deliver oxygen efficiently.

It is conducted by taking a small blood sample, typically from a vein in the arm, and then placing it in a centrifuge machine that rapidly spins the blood to separate its components. As the blood cells settle, they split into layers, with red blood cells sinking to the bottom due to their density. The hematocrit value is calculated as the ratio of the volume of red blood cells to the total volume of the blood sample, expressed as a percentage.

Downloadable Hematocrit Levels Chart here

Check out our free Hematocrit Levels Chart PDF

What is a Hematocrit Levels Chart?

The Hematocrit Levels Chart is a fundamental aid in healthcare for monitoring individuals' hematocrit values. This metric is invaluable for diagnosing and monitoring various medical conditions, including sickle cell anemia, iron deficiency anemia, and polycythemia.

For instance, in sickle cell anemia, the hematocrit levels may be lower due to the decreased lifespan of the abnormal sickle-shaped red blood cells. Conversely, hematocrit levels are typically elevated in polycythemia due to excess red blood cells.

Moreover, it equips patients with knowledge about the results of their hematocrit test, facilitates better engagement in their healthcare journey, and enables them to understand the importance of maintaining optimal blood health.

How does it work?

Checking that your patients have normal hematocrit levels in their blood samples requires specific documentation, which can help detect possible blood disorders or other health complications. To use the chart, follow these steps:

Step 1: Download the chart

Start by accessing a printable Hematocrit Levels Chart through the download link.

Step 2: Enter patient information

Enter their details at the top of the chart, including their name, date of birth, and other pertinent information. This ensures accuracy, reflecting their specific health profile.

Step 3: Record baseline hematocrit value

A hematocrit test will be conducted during the initial assessment, and their baseline value will be recorded on the chart. Explain the significance of this simple blood test in monitoring blood health over time.

Step 4: Note subsequent hematocrit values

Educate patients on the importance of regular hematocrit testing according to their healthcare plan. Record subsequent test results, including dates and values, to track changes and trends.

Step 5: Interpret and discuss

When patients bring their completed charts to appointments, take the time to interpret the data together. Discuss any notable fluctuations or trends and collaborate on any necessary adjustments to their treatment plan based on the findings.

Step 6: Empower patients for active engagement

Encourage patients to view the Hematocrit Levels Chart as a tool for active participation in their healthcare journey. Remind them of the value of monitoring healthy red blood cells, tracking progress, and engaging in informed discussions with you and other members of their healthcare team.

Hematocrit Levels Chart example (sample)

Review a sample of our Hematocrit Levels Chart, filled out for a fictitious patient. This example is provided for reference purposes only. Remember that the results you record will be based on your specific patient's data.

Download our Hematocrit Levels Chart PDF here:

Hematocrit Levels Chart example

When would you use this chart?

The Hematocrit Levels Chart is essential in various medical scenarios, enhancing patient care and treatment planning. Here are the critical situations where this chart proves invaluable:

  • Monitoring blood health: Healthcare practitioners use this chart to monitor blood health, especially in patients with conditions like anemia, polycythemia, and kidney disorders. Regular monitoring helps detect abnormalities early.
  • Diagnosing anemia: The chart aids in diagnosing anemia in patients showing symptoms such as fatigue, pale skin, and shortness of breath. A consistent drop in hematocrit levels can confirm this condition.
  • Assessing treatment efficacy: The chart evaluates the effectiveness of treatments for blood-related conditions. It helps determine if interventions like iron supplements or blood transfusions are working.
  • Chronic disease management: Patients with chronic conditions affecting blood health use this chart to monitor their hematocrit levels over time, assisting in disease management and treatment planning.
  • Athlete health: Sports medicine practitioners use the chart to monitor athletes' health. High hematocrit levels may indicate blood doping, which is banned in sports.
  • Research and studies: Medical researchers utilize the chart to collect and analyze data for studies on blood health, population health, and disease prevalence.
  • Pregnancy monitoring: Obstetricians use this chart to monitor hematocrit levels in pregnant women, as anemia during pregnancy can impact both mother and fetus.

Regular use of the Hematocrit Levels Chart allows healthcare providers to detect trends, assess treatment efficacy, and intervene promptly in case of abnormalities, ensuring optimal patient care.

Understanding hematocrit blood test results

Hematocrit values measure the proportion of red blood cells (RBCs) in the blood, offering crucial insights into various health conditions. For adult men, normal hematocrit ranges from 38.3% to 48.6%, and for adult women, from 35.5% to 44.9%. Values within these ranges indicate a healthy blood composition, suggesting the body has adequate RBCs to transport oxygen and maintain overall health efficiently.

Elevated hematocrit levels, known as polycythemia, can cause the blood to become thicker, increasing the risk of blood clots and heart problems. This condition necessitates further diagnostic tests to determine its cause. On the other hand, low hematocrit levels, indicative of anemia, mean insufficient RBCs to carry adequate oxygen to the body’s tissues. Anemia can result from various factors, including iron deficiency, chronic diseases, or nutritional deficiencies, and requires detailed evaluation for appropriate treatment.

Fluctuations in hematocrit levels may suggest ongoing medical conditions or responses to treatments, necessitating close monitoring by healthcare practitioners. A consistent decline in hematocrit levels may point to ongoing blood loss, chronic illness, or issues with RBC production, requiring immediate investigation. Factors such as age and sex can slightly affect hematocrit levels, making regular monitoring and professional interpretation essential for maintaining optimal health.

Why use Carepatron as your patient record software?

Recording test results, such as hematocrit levels and other patient data, should not burden a healthcare professional. That's why we at Carepatron are here to facilitate easy record-keeping.

Our patient record software simplifies data entry, saving time and reducing errors. Our patient portal lets patients access their health records anytime, making keeping them informed and engaged easier. Our appointment scheduling feature helps you manage your calendar efficiently, reducing no-shows and improving patient flow.

Additionally, Carepatron offers secure storage for all patient records, ensuring privacy and compliance with healthcare regulations. The user-friendly interface means you can quickly find and update patient information.

Join us today and embrace the convenience of modern technology.

Who typically requests a Hematocrit Levels Chart?

Commonly asked questions

Who typically requests a Hematocrit Levels Chart?

Hematocrit Level Charts are typically requested by healthcare practitioners, including hematologists, general practitioners, and nurses, to monitor patients' blood health.

When are Hematocrit Levels Charts used?

Hematocrit Level Charts monitor blood health in various scenarios, including diagnosing anemia, assessing treatment efficacy, managing chronic diseases, and tracking athlete health.

How are Hematocrit Levels Charts used?

Hematocrit Levels Charts record hematocrit values over time, typically in a graphical format. Patients and healthcare providers collaborate to track blood health changes, trends, and deviations.

Join 10,000+ teams using Carepatron to be more productive

One app for all your healthcare work