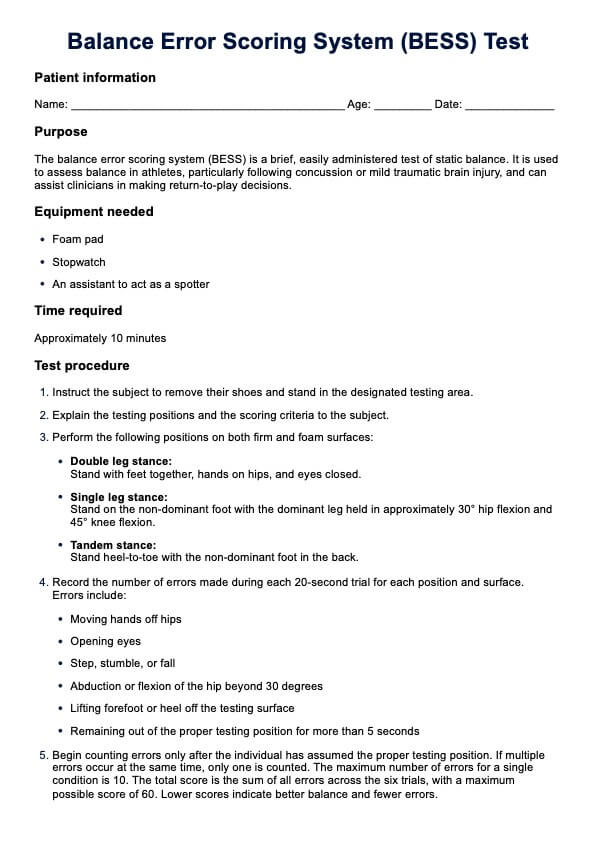
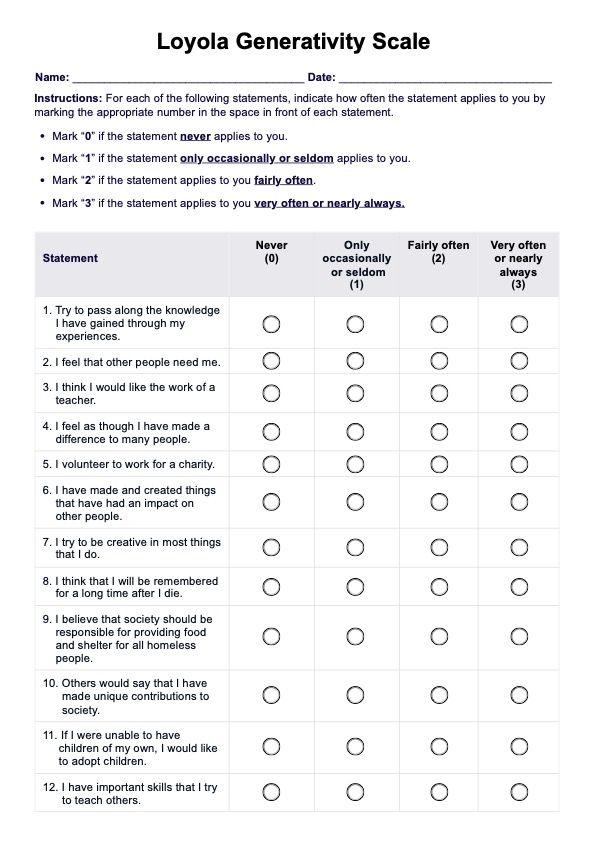
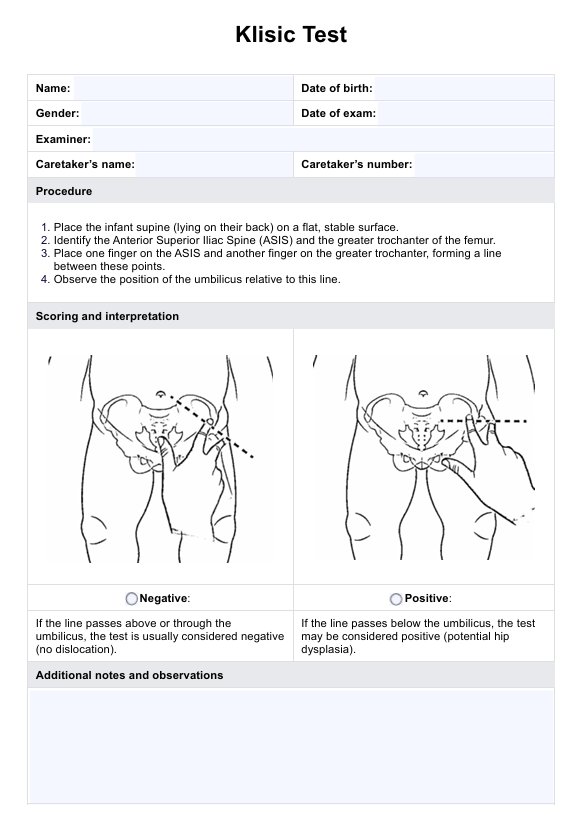
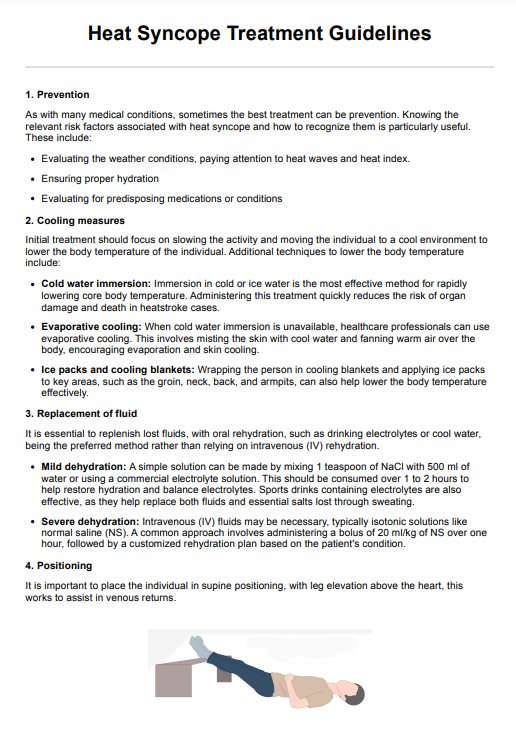
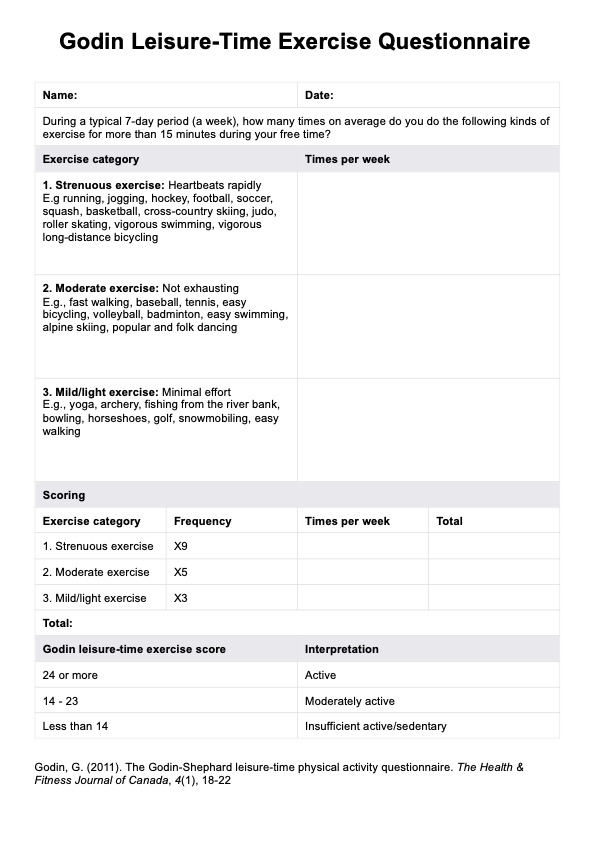
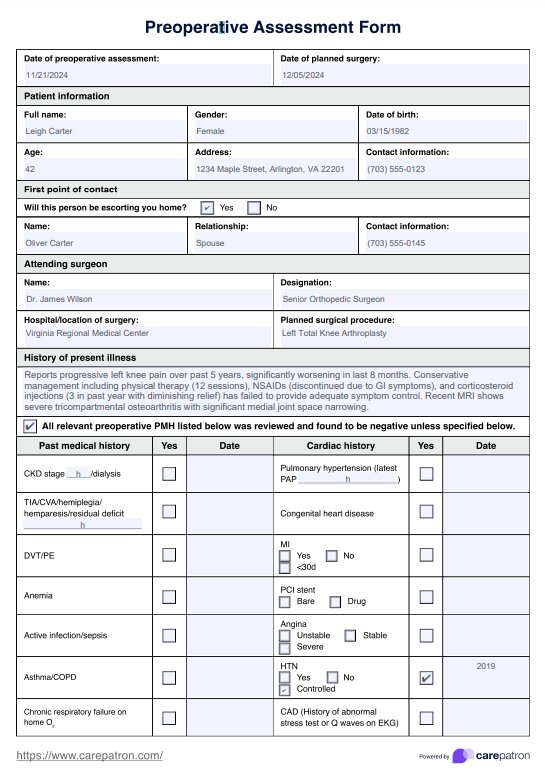
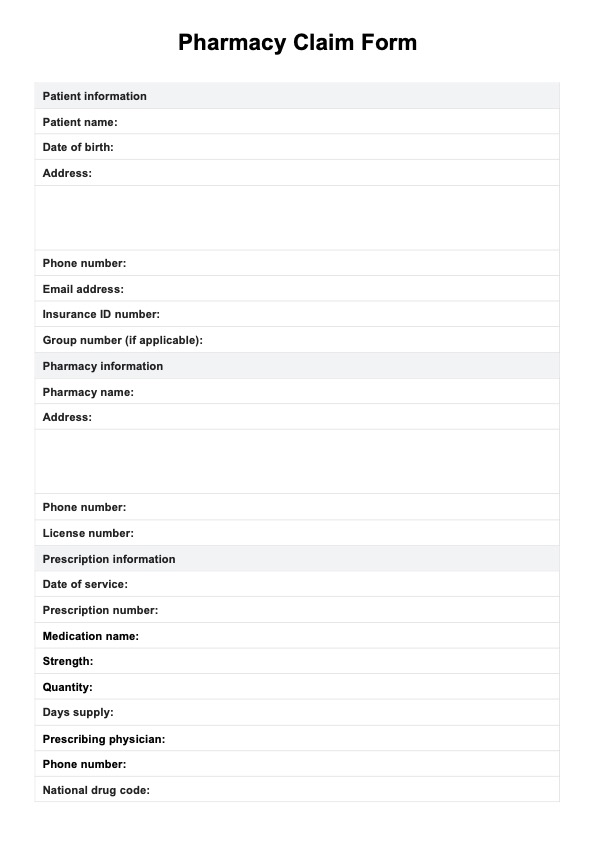
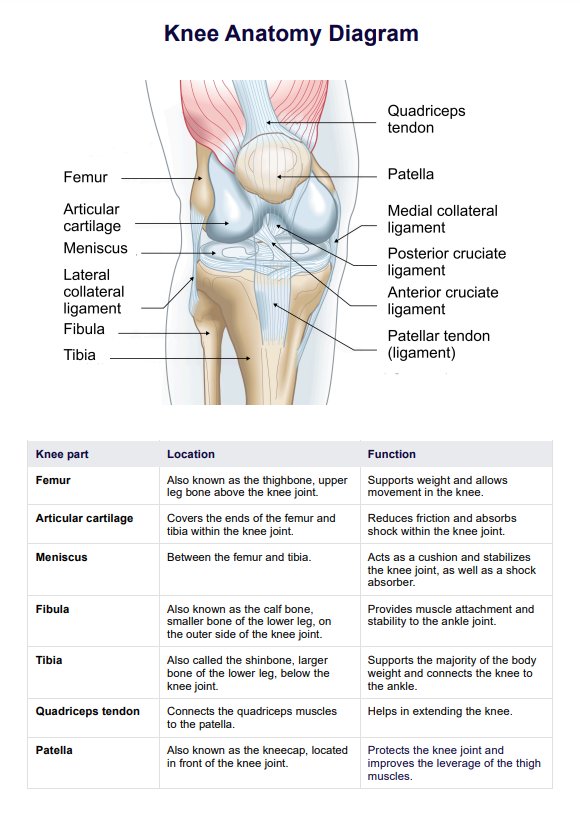
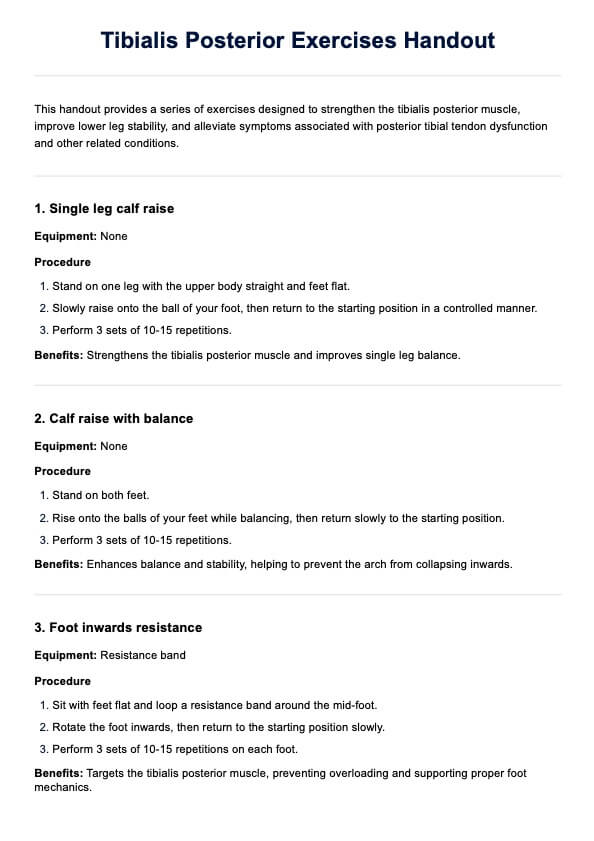
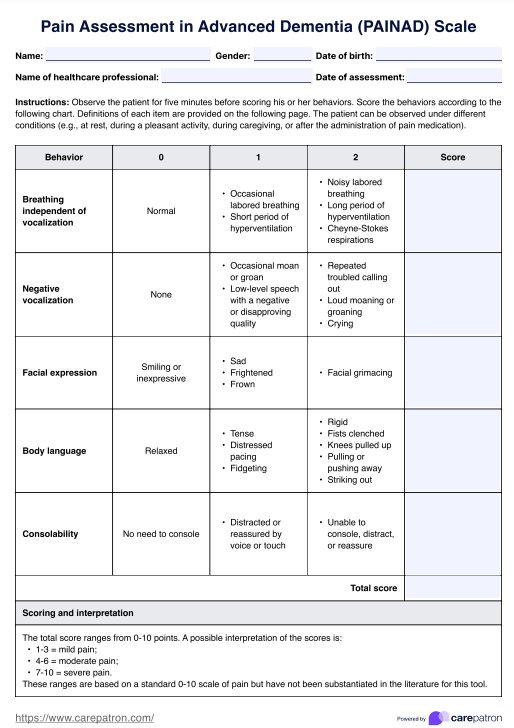
Wiggers Diagram
Access our Wiggers Diagram handout for a detailed overview of the cardiac cycle, including phases, pressure changes, and valve dynamics, designed for healthcare professionals.

Fact Checked by Ericka Pingol.


What is a Wiggers Diagram?
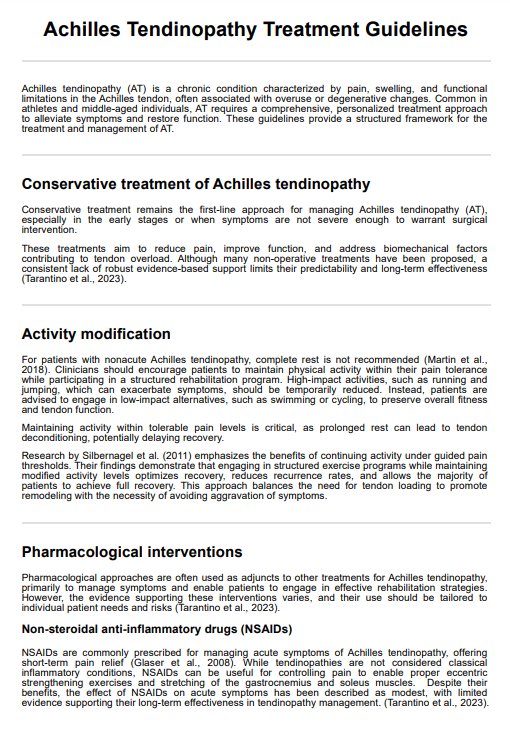
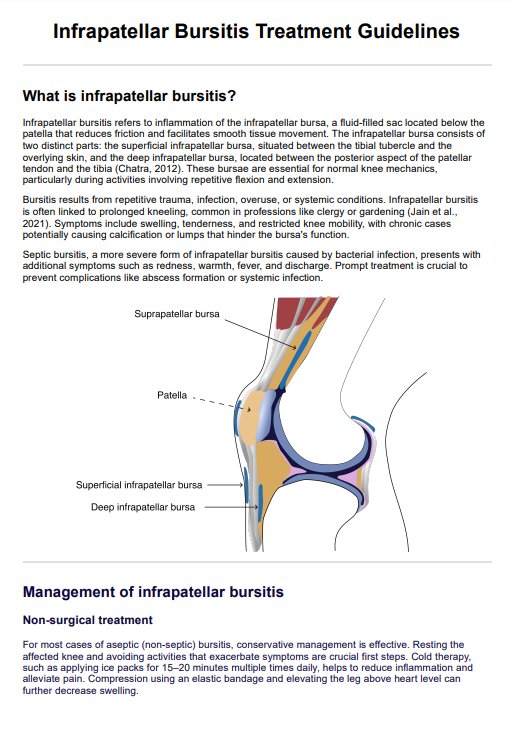
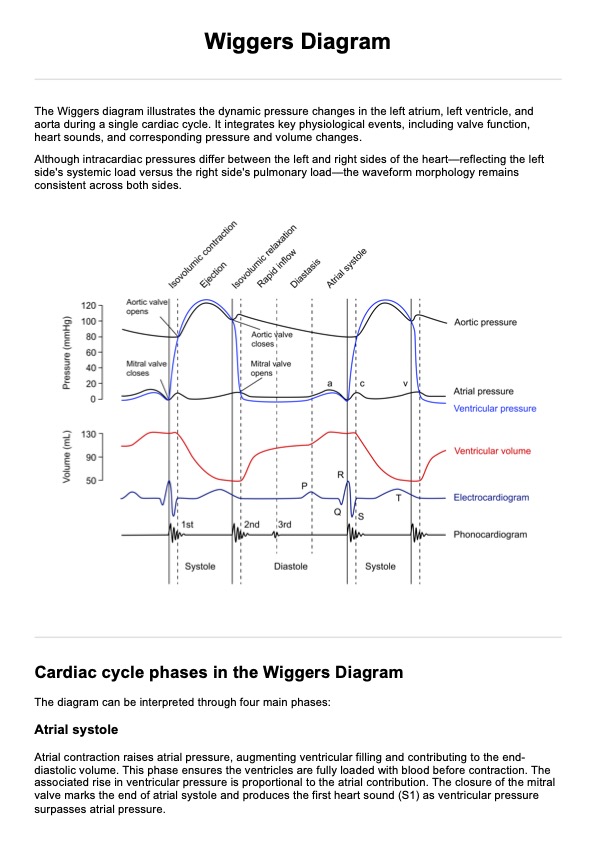
The Wiggers Diagram is a detailed representation of the cardiac cycle, illustrating the changes in pressure, volume, and electrical activity in the heart. It captures the dynamics of the left atrium, left ventricle, and aorta, alongside events like valve movements, heart sounds, and ventricular volume changes. By integrating these elements with the electrocardiogram (ECG), the diagram provides a holistic view of the heart's function during a single heartbeat. While the absolute pressures differ between the left and right sides of the heart due to their respective systemic and pulmonary roles, the waveform patterns remain consistent.
Our handout provides an overview of this diagram, offering context and breaking down its components for easier interpretation. It highlights the phases of the cardiac cycle—atrial systole, isovolumetric contraction, ventricular ejection, and diastole—describing how each phase corresponds to specific mechanical and electrical events. This reference helps bridge the detailed information from the diagram with a clear explanation of the processes it represents.
Wiggers Diagram Template
Wiggers Diagram Example

How to use our Wiggers Diagram handout
To effectively use the Wiggers Diagram handout and provide valuable insights into the cardiac cycle, follow these steps:
Step 1: Access the handout
Access the Wiggers Diagram handout through this guide by clicking the "Use template" button to open it in the Carepatron app. Alternatively, you can download a PDF version for offline use. This flexibility allows you to tailor the handout to your teaching or practice needs, ensuring it is available in the format that works best for you.
Step 2: Use the handout during discussions or consultations
Refer to the handout during lectures, study sessions, or patient consultations to explain the key phases of the cardiac cycle. Use it to clarify relationships between changes in pressure, volume, and electrical activity, as well as valve dynamics and heart sounds. Highlight specific sections of the diagram that are relevant to the learner's or patient’s questions, and provide practical explanations to reinforce understanding.
Step 3: Share and store the handout securely
After reviewing the handout, you can share a copy via the Carepatron app so individuals can refer to it at their own pace. Keeping the handout accessible supports consistent follow-ups and allows for reinforced understanding of cardiac processes.
By using the Wiggers Diagram handout effectively, healthcare professionals, educators, and students can enhance communication, improve learning outcomes, and deepen comprehension of the cardiac cycle.
Benefits of using the Wiggers Diagram handout
Here are some of the benefits of using Careptron's free diagram handout:
Enhanced understanding of the cardiac cycle
The handout breaks down complex cardiac processes into an easy-to-follow visual representation, helping students, healthcare professionals, and patients gain a clear understanding of the relationships between pressure changes, valve dynamics, and heart sounds during each phase of the cardiac cycle.
Improved communication
Using the handout during discussions or consultations facilitates better communication. It provides a shared reference point that simplifies the explanation of intricate concepts, ensuring learners and patients can follow along and engage more effectively.
Customizable and accessible
The handout is available in a customizable format via the Carepatron app, allowing users to adapt it to their specific needs. Whether used as a digital tool or printed for offline use, it ensures flexibility and accessibility.
Supports retention and review
By offering a visual guide to the cardiac cycle, the handout aids in memory retention and serves as a convenient reference for future review. Its clear and concise layout ensures that key information is easily revisited whenever needed.
By leveraging these benefits, the Wiggers Diagram handout becomes an indispensable tool for education, clinical practice, and patient support.
Understanding the cardiac cycle
The cardiac cycle is a dynamic process involving the coordination of electrical, mechanical, and hemodynamic events to maintain blood flow and ensure efficient cardiac output. The Wiggers Diagram is an invaluable resource for visualizing this process, illustrating how changes in pressure, volume, and valve function are synchronized throughout the heart’s activity.
The role of atrial contraction
The cardiac cycle begins with the sinoatrial node, which initiates electrical impulses visible as the p wave on an ECG. This marks atrial contraction, where the atria contract to increase atrial pressure and contribute to ventricular end diastolic volume. During this phase, the mitral valve and tricuspid valve are open, allowing ventricular filling on both the right and left sides of the heart.
Ventricular depolarization and isovolumic contraction
Following atrial contraction, ventricular depolarization occurs, represented by the QRS complex. This signals the start of lv contraction and the phase of isovolumic contraction, where ventricular pressure increases rapidly without any change in lv volume. During this phase, all heart valves are closed, ensuring that the necessary pressure difference is established for effective ejection.
The ejection phase
As ventricular systole progresses, the aortic valve opens, initiating the ejection phase. Blood is ejected into the systemic circulation, causing aortic pressure to rise. The amount of blood ejected is quantified as the stroke volume, calculated by the difference between the end diastolic volume and the end systolic volume. This phase showcases the efficiency of the heart’s cardiac output in both healthy subjects and those with conditions like severe aortic stenosis.
Isovolumetric relaxation and early diastole
Once ejection is complete, the aortic valve closes, marking the beginning of isovolumetric relaxation. During this phase, ventricular relaxation occurs with no change in volume, as all valves remain shut. As ventricular pressure falls below atrial pressure, the mitral valve opens, restarting ventricular filling in early diastole. This phase ensures the heart is primed for the next cycle of blood flow.
Integrating cardiovascular physiology
The Wiggers Diagram provides a comprehensive overview of the cardiac cycle by linking mechanical events, such as aortic valve closure and ventricular filling, with physiological markers like heart rate and stroke volume. It is a critical tool for physiology education and cardiovascular pedagogy, offering insight into how the left ventricular and right and left sides of the heart function in unison.
Commonly asked questions
The Wiggers Diagram is a detailed graphical representation of the cardiac cycle, correlating pressure, volume, and electrical changes with mechanical events. The handout provides essential information about cardiac function, visually demonstrating how the ventricles, heart valves, and other structures coordinate to maintain efficient blood flow. It serves as a comprehensive reference for students, educators, and healthcare professionals.
The pulmonary artery is depicted in the Wiggers Diagram handout as the vessel carrying deoxygenated blood from the right ventricle to the lungs during the ejection phase of the cardiac cycle. The diagram illustrates how rising right ventricular pressure forces the heart valves open, ensuring smooth blood flow to the pulmonary circuit.
The Wiggers Diagram handout identifies the source and timing of heart sounds. The first sound (S1) corresponds to the onset of ventricular systole, marked by the closure of the atrioventricular valves. The second sound (S2) occurs when the semilunar valves close at the end of ventricular systole. These sounds are clearly linked to the mechanical events shown in the diagram, helping users understand their significance in valve function and heart activity.
Related Templates

Popular Templates