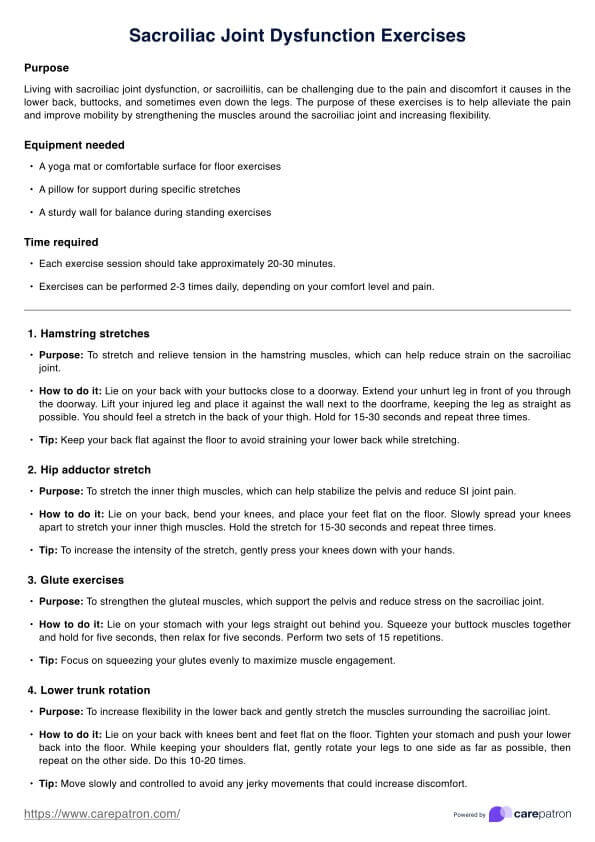
Urinalysis Result Interpretation
Discover key insights with our Urinalysis Result Interpretation Chart, your essential guide for accurate urine test analysis.
.jpg)
Fact Checked by RJ Gumban.


What is a Urinalysis Result Interpretation Chart?
A Urinalysis Result Interpretation Chart is a comprehensive tool that helps healthcare professionals assess and interpret urine test results. It outlines normal and abnormal ranges for various components found in urine, guiding medical professionals in diagnosing conditions related to the kidneys, liver, and urinary tract. The chart aids in identifying abnormalities such as red blood cells, white blood cells, urine crystals, and urinary casts, all of which can signal underlying conditions like kidney disease, urinary tract infections, or severe liver disease.
The urinalysis process involves a urine examination that assesses the sample’s physical, chemical, and microscopic characteristics. For example, abnormalities in urine osmolarity or the presence of concentrated urine may indicate dehydration, while the presence of red or white blood cells could point to an infection or kidney disorder. The chart is an essential resource for evaluating conditions like diabetes, chronic kidney disease, or electrolyte imbalances through the examination of urine specimens.
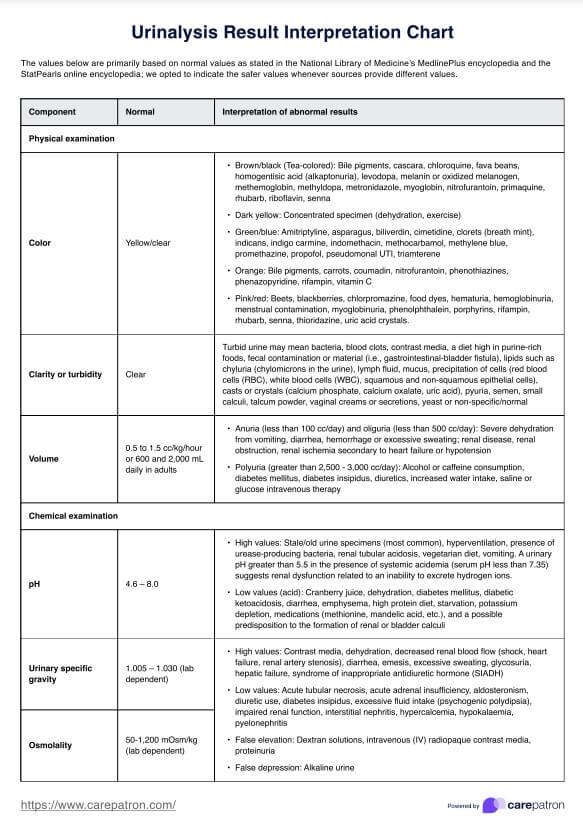
Urinalysis Result Interpretation Template
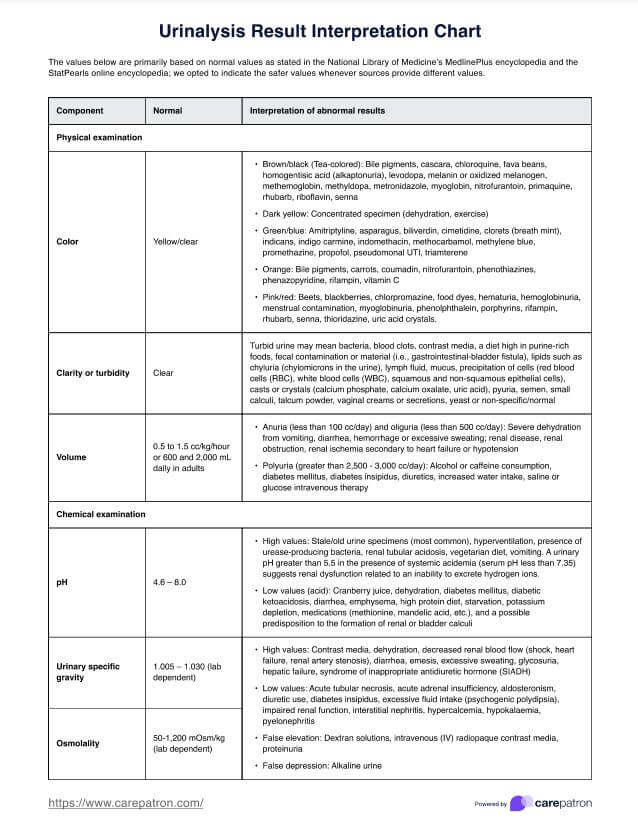
Urinalysis Result Interpretation Example
How to use our Urinalysis Result Interpretation Chart template
Understanding the workings of urinalysis and the subsequent interpretation of results is a multi-step process that requires precision and attention to detail. Here's a breakdown of how you can use our normal urine test results chart template in your practice:
Step 1: Access the template
Use the Carepatron app to access our chart template. Click “Use Template” to open it in the app, allowing you to customize, fill out, and share the template. Alternatively, you can click “Download” to save a non-editable PDF version for printing or manual use.
Step 2: Collect the urine sample
Accurate results depend on the quality of the urine sample. A clean-catch, midstream specimen is essential to avoid contamination. Instruct patients to urinate briefly, pause, and then collect the sample midstream. This ensures a representative sample for analysis.
Step 3: Conduct the urinalysis
You can perform a urinalysis yourself using a dipstick test or send the urine sample to a laboratory for a more detailed examination. The process typically includes a physical, chemical, and microscopic examination to detect substances like proteins, glucose, ketones, and signs of bacterial growth. A complete urinalysis includes identifying abnormalities in color, clarity, pH, specific gravity, and microscopic elements such as cells or crystals.
Step 4: Use the chart for interpretation
Once the results are available, use the Urinalysis Result Interpretation Chart as a reference. The chart lists normal ranges for each parameter and provides insights into what abnormal results may indicate. For example, the presence of nitrites could suggest a urinary tract infection (UTI), while glucose in the urine could indicate diabetes. We'll discuss this further in a later section, but for a complete list, use the template.
Step 5: Clinical assessment
Finally, any deviations from normal values are considered alongside the patient's clinical presentation. This integrated approach ensures that the urinalysis results contribute meaningfully to the diagnostic process, guiding further testing or immediate treatment if necessary.
Do take note that this template is best used as a reference; if you are looking for a template for documenting the results of a urinalysis test, take a look at our Urinalysis Test Results template.
When would you use this chart?
The Urinalysis Result Interpretation Chart is a fundamental tool in clinical settings, employed by a wide array of healthcare professionals to aid in the diagnosis and monitoring of various health conditions. Here are some of the key instances when this chart proves essential:
- Routine health screenings: During annual physical exams or specific health screenings, a urinalysis is often performed to check for early signs of diseases such as diabetes, liver disease, and kidney disorders. The interpretation chart helps in quickly identifying any deviations from normal urine composition.
- Symptomatic diagnosis: When patients present with abdominal pain, back pain, frequent urination, or painful urination, a urinalysis may be conducted to confirm or rule out conditions like urinary tract infections, kidney stones, or other renal pathologies.
- Management of chronic conditions: For individuals with chronic conditions such as diabetes or hypertension, which can affect kidney function, the chart monitors changes in urine that may indicate disease progression or complications.
- Postoperative care: Following surgeries, particularly those involving the urinary tract or affecting renal function, urinalysis ensures that the patient's urinary system is recovering properly. The chart helps interpret results that could signal postoperative complications.
- Pharmacotherapy monitoring: Certain medications can impact kidney function or be nephrotoxic. The chart assists in interpreting urine results to monitor the effects of long-term medication use on the kidneys.
- Prenatal checkups: Urinalysis is a standard test during pregnancy to screen for conditions like preeclampsia or gestational diabetes. The interpretation chart allows for quick assessment of the mother's urine, ensuring the health of both mother and fetus.
How to interpret urinalysis results
Interpreting urinalysis results involves examining urine samples to detect possible conditions like urinary tract infection, kidney disease, or diabetes mellitus. By comparing these results against the normal range provided in the urinalysis chart, medical professionals can identify abnormalities and guide treatment decisions. Do take note that this is just a short description; for a complete list of what each abnormal result means, please use the template as reference.
- Physical examination: This includes assessing the urine's color, clarity, and urine concentration. Dark urine might signal dehydration, liver problems, or chronic kidney disease, while frothy urine can indicate proteinuria, often associated with renal disease. The pH level is crucial; acidic urine could suggest diabetes mellitus, while alkaline urine might point to bacterial infections or dietary influences. All findings must be checked against the template's standard values.
- Chemical examination: This measures substances found in urine, such as glucose, proteins, ketones, bilirubin, and nitrites. High glucose levels may point to diabetes mellitus, while the presence of nitrites or leukocyte esterase suggests a urinary tract infection. Elevated proteins could signal kidney disease or acute tubular necrosis. Compare these findings with the normal values in the chart to determine the next steps, which may involve further tests such as a urine culture.
- Microscopic examination: This part of the test looks at elements like red and white blood cells, urinary casts, crystals, or bacteria. For instance, red blood cells in fresh urine could indicate trauma or chronic kidney disease, while white blood cells or bacteria suggest urinary tract infection. Crystals might signal kidney stones, and urinary casts can help pinpoint conditions like acute tubular necrosis. Cross-check these results with the template's values to identify potential issues.
Once all findings are compared against the normal range in the chart, further tests may be necessary to clarify ambiguous results. Abnormalities found during urine tests might require follow-up testing, such as blood work or imaging, to rule out conditions like chronic kidney disease, renal disease, or diabetes mellitus. This ensures an accurate diagnosis and appropriate care plan for the patient.
Commonly asked questions
Examples include the presence of blood, bacteria, or high levels of glucose or protein in the urine, which could indicate conditions such as urinary tract infections, kidney disease, or diabetes.
A urine culture result is positive if it shows bacterial growth, indicating an infection. The type and quantity of bacteria will guide treatment options, such as antibiotics.
To diagnose a UTI, check for the presence of nitrites, leukocyte esterase, and white blood cells in the urine. These indicators suggest bacterial infection in the urinary tract.
Related Templates

Popular Templates