Protein/Creatinine Ratio Chart
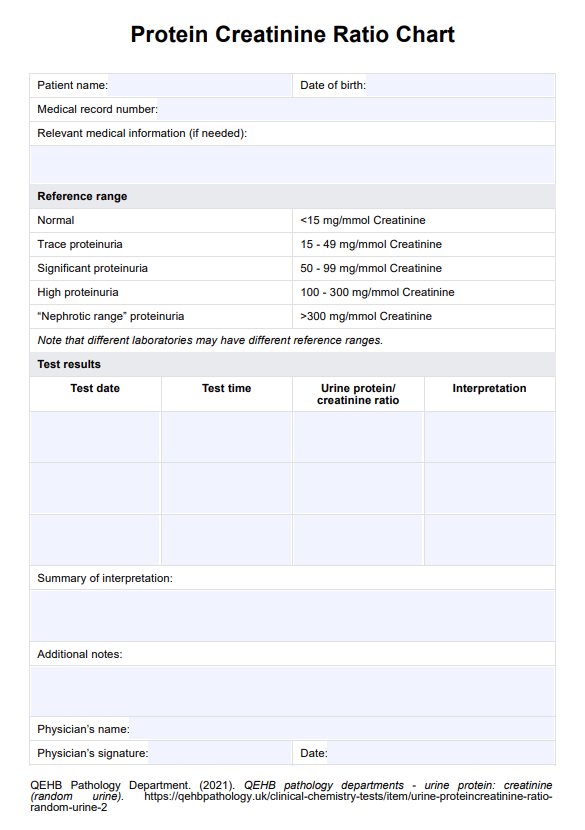
Better assess your patient's kidney function by using our Protein/Creatinine Ratio Chart.

What is a Protein/Creatinine Ratio Chart?
A Protein/Creatinine Ratio Chart or urine protein/urine creatinine ratio chart is a valuable tool used in healthcare to assess kidney function and detect potential issues related to protein levels in the urine. It's a graphical representation or table illustrating the urine protein/creatinine ratio in urine samples.
The protein/creatinine ratio is crucial as it helps evaluate the amount of protein in urine, offering insights into kidney health. Normally, the kidneys filter waste and excess substances, reabsorbing essential proteins and keeping them in the bloodstream. When the kidneys are not functioning optimally, protein excretion can happen, indicating possible kidney damage or disease.
This chart allows healthcare practitioners to track protein excretion rate or level changes over time. Monitoring the kidney function with this ratio helps in the early detection of kidney problems, such as kidney disease, diabetes-related kidney complications, or high blood pressure, enabling timely intervention and better management of these conditions. Additionally, it aids in assessing the effectiveness of treatments or lifestyle modifications implemented to address kidney health concerns.
In essence, this chart is a pivotal aid in routine check-ups, disease management, and proactive healthcare. It empowers healthcare providers to make informed decisions about a patient's kidney health and provide timely, targeted interventions when necessary.
Protein/Creatinine Ratio Chart Template
Protein/Creatinine Ratio Chart Example
How does our Protein/Creatinine Ratio Chart work?
The Protein/Creatinine Ratio Chart serves as a tool to evaluate kidney health or monitor kidney function by analyzing the ratio of protein to creatinine levels in urine samples. Follow these steps to use our chart:
Step 1: Download the chart
Get a copy of the chart by clicking the "Use template" button to access it via the Carepatron app. This lets you modify the form before use.
Step 2: Gather patient information
Healthcare practitioners fill in essential patient details on the form, such as the patient's name, date of birth, medical record number, and test date. This information helps in accurately identifying and tracking the patient's test results.
Step 3: Conduct the test
During a patient visit, a urine sample is collected. This sample is then tested for protein and creatinine levels. The protein level in the urine indicates the presence of proteinuria, potentially signaling kidney issues, while creatinine, a waste product, is measured to standardize the protein levels.
Step 4: Record test results
The obtained test results, including the date and time of urine collection and the measured protein and creatinine levels, are meticulously recorded in the provided spaces on the chart.
Step 5: Calculate the ratio
The healthcare practitioner uses the recorded protein and creatinine values to calculate the Protein/Creatinine Ratio by dividing the protein value by the creatinine value. This ratio indicates the amount of protein relative to creatinine in the urine.
Step 5: Interpret the results
Interpretation involves comparing the calculated Protein/Creatinine Ratio against the normal protein-creatinine ratio ranges provided on the chart.
Step 6: Provide recommendations
Based on the interpretation of results, healthcare practitioners suggest appropriate steps, including lifestyle changes, further tests like blood tests to check the blood urea nitrogen and the serum creatinine, or specialist consultation to address any identified kidney health concerns.
You can also use the Medical Record template to document patient information and track their health progress systematically. This template ensures all critical details are recorded accurately for effective management and continuity of care. It helps maintain comprehensive and organized patient files.
When would you use this Protein/Creatinine Ratio Chart?
Healthcare practitioners, particularly nephrologists, urologists, primary care physicians, and healthcare professionals specializing in kidney health, employ the Protein/Creatinine Ratio Chart as a fundamental resource in various clinical scenarios.
Routine health check-ups
During routine health assessments, this chart serves as a pivotal tool to evaluate kidney function. It aids in the early detection of potential kidney issues in patients, allowing practitioners to provide timely interventions and prevent the progression of kidney-related disorders.
Chronic kidney disease monitoring
For patients diagnosed with chronic kidney disease, regular monitoring using the Protein/Creatinine Ratio Chart is essential. It assists in assessing disease progression, treatment efficacy, and the overall management of the condition.
Diabetes and hypertension management
Patients with diabetes or hypertension are at a higher risk of developing kidney complications. This chart is beneficial in monitoring kidney health in these individuals, enabling early detection of issues and prompt intervention to prevent further damage.
Preventive care in high-risk individuals
Individuals with a family history of kidney diseases or those predisposed to kidney issues due to genetic factors can benefit from regular screenings using the Protein/Creatinine Ratio Chart. Early identification allows for timely management and lifestyle modifications.
Medication and treatment monitoring
In patients undergoing certain treatments or medications that may impact kidney function, regular monitoring using this chart ensures close observation of any alterations in kidney health.
The Protein/Creatinine Ratio Chart proves instrumental in assessing and tracking kidney health. Its utilization ranges from general health check-ups to managing chronic conditions, offering a straightforward and cost-effective means of evaluating kidney function. By using this chart, practitioners can detect and address potential kidney issues early, facilitating proactive healthcare management and improved patient outcomes.
What do the results on the Protein/Creatinine Ratio Chart mean?
The results derived from a Protein/Creatinine Ratio Chart indicate kidney health and can be interpreted based on the calculated ratio and established normal ranges. A free Protein/Creatinine Ratio Chart can help healthcare practitioners and patients comprehend these results better.
Here are the possible test results and corresponding interpretations you will find on the chart template (QEHB Pathology Department, 2021):
- Normal: <15 mg/mmol Creatinine
- Trace protenuria: 15 - 49 mg/mmol Creatinine
- Significant proteinuria: 50 - 99 mg/mmol Creatinine
- High proteinuria: 100 - 300 mg/mmol Creatinine
- "Nephrotic range" proteinuria: >300 mg/mmol Creatinine
Understanding these results is crucial as they help practitioners and patients comprehend the state of kidney health. Elevated or reduced values prompt further evaluation, possibly including additional tests, medical consultations, and lifestyle adjustments. However, note that various laboratories may have different reference ranges. Monitoring changes in the Protein/Creatinine Ratio over time aids in tracking the progression of kidney-related issues and evaluating the effectiveness of interventions or treatments.
Reference
QEHB Pathology Department. (2021). QEHB pathology departments - urine protein:creatinine ratio (random urine). Qehbpathology.uk. https://qehbpathology.uk/clinical-chemistry-tests/item/urine-proteincreatinine-ratio-random-urine-2
Commonly asked questions
This ratio helps in identifying kidney health issues. Abnormal ratios can indicate potential kidney problems such as kidney disease, diabetes-related complications, or high blood pressure.
It's calculated by dividing the measured protein concentration in the urine by the measured creatinine concentration. The ratio is expressed as milligrams of protein per milligram of creatinine (mg/mg).
The normal range falls between 0.15 to 0.25 mg/mg. Ratios above this range can indicate proteinuria (excessive protein in urine), suggesting possible kidney issues. Ratios below this range may indicate low protein levels or other kidney-related problems.