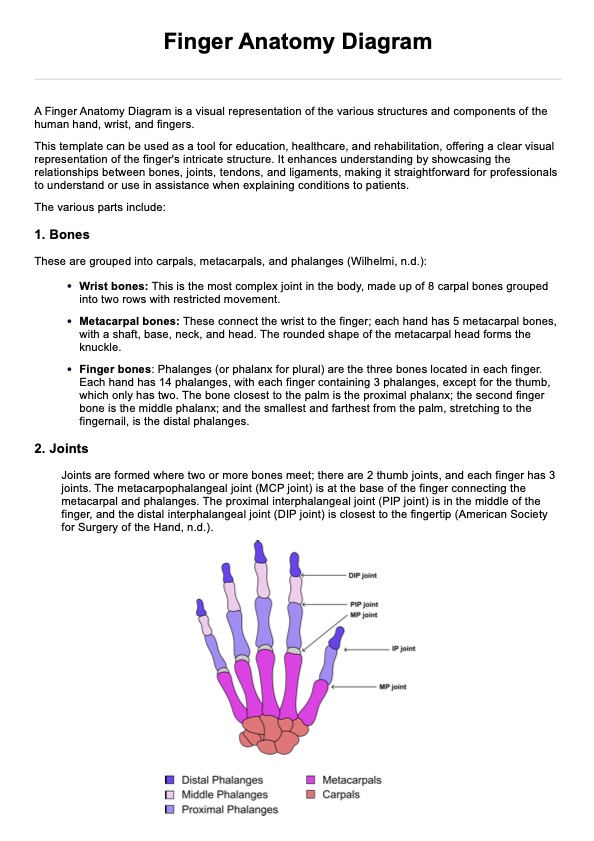
BUN/Creatinine Ratio Chart
Track kidney function and make informed decisions for personalized healthcare with our BUN/Creatinine Ratio Chart. Optimize patient care today.

Fact Checked by Ericka Pingol.


What is a BUN/Creatinine Ratio Chart?
A BUN/Creatinine Ratio Chart is a valuable resource in healthcare, providing a comprehensive overview of the Blood Urea Nitrogen (BUN) to Creatinine ratio in the blood. This chart visually represents the relationship between two critical blood markers, offering insights into kidney function and overall metabolic health.
The BUN/Creatinine Ratio is a calculated value obtained by dividing the BUN level by the serum creatinine level. This ratio is crucial in assessing the potential causes of abnormal BUN or creatinine levels. An average BUN/Creatinine Ratio falls within a specific range, and deviations from this range can provide valuable diagnostic information.
Generally, the chart visually represents the normal range for the BUN/Creatinine Ratio. Healthcare practitioners use this chart to interpret the results of blood tests and identify imbalances that may cause abnormal BUN/creatinine levels, such as kidney dysfunction, dehydration, congestive heart failure, urinary tract obstruction, or other underlying health issues. Abnormal ratios may prompt further investigation, such as additional tests or medical interventions, to address potential kidney problems.
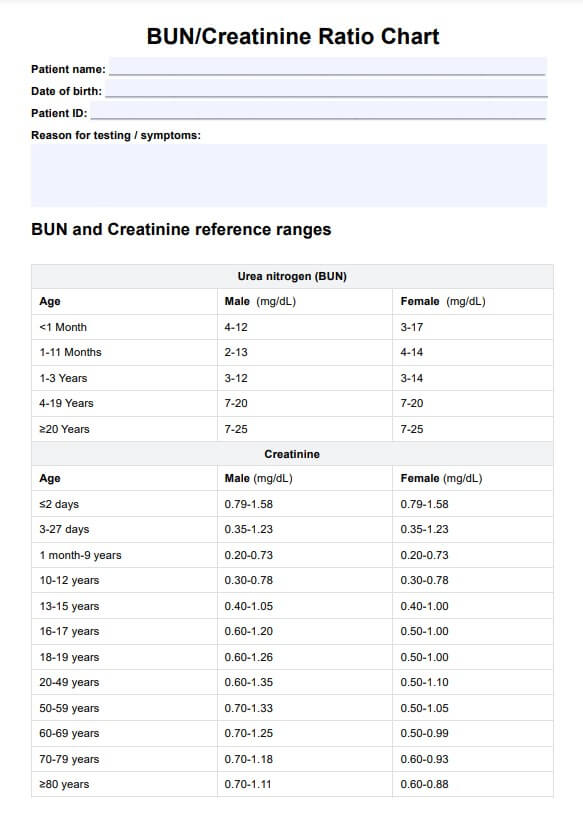
BUN/Creatinine Ratio Chart Template
BUN/Creatinine Ratio Chart Example
How does the BUN/Creatinine Ratio Chart work?
Understanding and utilizing a bun creatinine ratio chart is straightforward, assisting healthcare professionals in evaluating kidney function and metabolic health. Here's a breakdown of the steps involved:
Step 1: Access the form
Obtain a printable BUN/Creatinine Ratio Chart by clicking "Use Template" for the in-app version and "Download" for the PDF version.
Step 2: Identify patient information
Please fill in essential patient details, including name, date of birth, and other required identifiers. Accurate patient information is crucial for proper record-keeping.
Step 3: Obtain BUN and creatinine values
After collecting blood samples and conducting blood tests, specifically a BUN and creatinine test, retrieve the BUN and creatinine values from the results. These values are typically provided in units of mg/dL (milligrams per deciliter).
Step 4: Calculate the BUN/Creatinine ratio
Use the formula: BUN/Creatinine Ratio = BUN level (mg/dL) / Creatinine level (mg/dL). Perform the calculation to obtain the ratio.
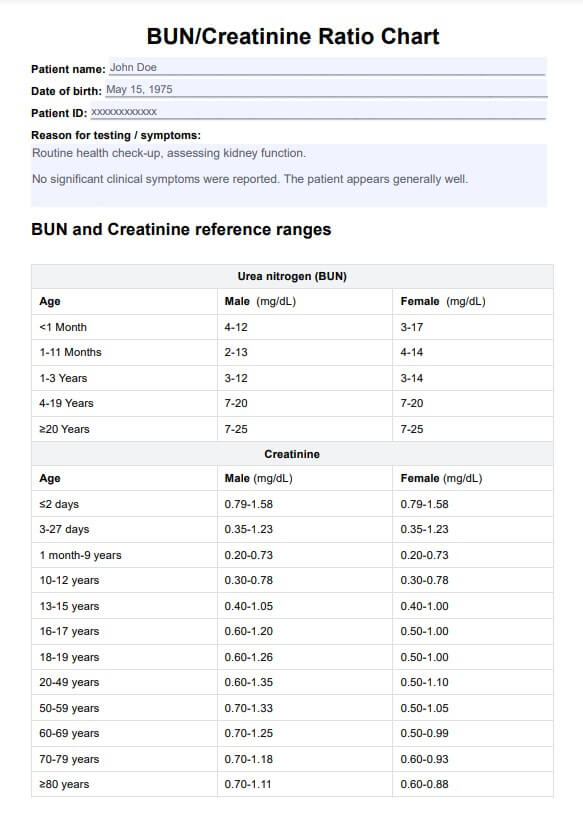
Step 5: Refer to the chart
Consult the BUN/Creatinine Ratio Chart for reference ranges. It will likely be presented as a visual guide with a range of expected values. Locate where the calculated ratio falls within this range.
Step 6: Interpret results
Analyze the position of the calculated ratio on the chart. A ratio within the normal range suggests healthy kidney function, while deviations may indicate potential issues that require further investigation.
Step 7: Document and share
Record the calculated ratio on the chart. This information can be included in patient records and shared with colleagues or specialists involved in the patient's care.
Step 8: Take necessary actions
Based on the interpretation, you may request for recommend additional tests, note down interventions, or make adjustments to the patient’s treatment plan as needed to address kidney diseases like chronic renal disease.
What do the results mean?
Interpreting the results of a BUN/Creatinine Ratio Chart is crucial for understanding kidney function and metabolic health. Here's a breakdown of expected ratio outcomes and their implications:
Normal range
A ratio within the normal range typically suggests healthy kidney function. This range can vary slightly between laboratories, but it commonly falls between 10:1 and 20:1. In this scenario, the kidneys efficiently filter waste products, and metabolic processes function optimally.
High BUN/Creatinine ratio
Conversely, an elevated ratio may signal dehydration, a diet high in protein, kidney disease, possible acute renal failure, or other conditions affecting the absorption of nutrients or blood flow to the kidneys.
Low BUN/Creatinine ratio
A low ratio may result from malnutrition, advanced liver disease, overhydration, or certain medications. Careful assessment is required to determine the underlying cause, and appropriate management is required.
Meanwhile, here are the implications for the individual values:
Elevated BUN with normal creatinine
An elevated BUN level with an average creatinine level may indicate issues outside the kidneys, such as dehydration or gastrointestinal bleeding. Elevated BUN can result from increased protein breakdown or reduced fluid intake.
Elevated creatinine with normal BUN
Elevated creatinine with an average BUN level is often associated with impaired kidney function. This could signal acute or chronic kidney disease, where the kidneys struggle to filter and excrete waste efficiently.
Though the BUN/creatinine ratio is a valuable diagnostic tool, it still has certain limitations and considerations. For example, values may vary slightly due to age, pregnancy, or pre-existing conditions such as severe liver disease or malnutrition. Furthermore, when confirming a diagnosis of or treating kidney disease or acute kidney injury, it's best to conduct other tests to provide a full picture.
When would you use this BUN/Creatinine Ratio Chart?
The BUN/Creatinine Ratio Chart is a valuable resource in various healthcare scenarios. Here are vital instances when this chart proves instrumental for relevant practitioners:
- Routine health check-ups: Incorporate the chart in routine health screenings to assess kidney function as part of comprehensive check-ups.
- Nephrology assessments: This is essential for nephrologists when evaluating patients with known or suspected kidney disorders. The chart helps in diagnosing conditions such as acute or chronic kidney disease.
- Preoperative assessments: Include the BUN/Creatinine Ratio Chart in preoperative evaluations to ensure optimal kidney function before surgical procedures, helping to identify potential complications.
- Monitoring chronic conditions: Use the chart for ongoing monitoring of patients with chronic conditions affecting the kidneys, such as diabetes or hypertension.
- Dehydration assessment: Implement the ratio chart to evaluate dehydration, as elevated BUN levels may indicate reduced fluid volume.
- Medication management: Useful for practitioners managing medications that can impact kidney function. Regular monitoring of the chart helps ensure medication safety.
- Emergency room admissions: Incorporate the chart in emergency settings to quickly assess and triage patients with potential kidney issues, providing timely interventions.
- Geriatric care: Particularly relevant in senior care, where kidney function may be more vulnerable. The chart aids in assessing and managing kidney health in older adults.
- Sports medicine: The chart can be a valuable diagnostic tool for sports medicine practitioners, especially when dehydration might be a concern.
- Pregnancy monitoring: During prenatal care, the chart helps monitor kidney function in pregnant individuals, ensuring early detection of potential complications.
Commonly asked questions
Healthcare professionals, including nephrologists, general practitioners, and specialists, often request charts to assess kidney function and metabolic health.
BUN/Creatinine Ratio Charts are used in various scenarios, including routine health check-ups, nephrology assessments, preoperative evaluations, and ongoing monitoring of chronic kidney conditions.
The process involves obtaining blood samples, measuring BUN and creatinine levels, calculating the ratio, and consulting the chart to interpret results. It aids in diagnosing kidney disorders and guiding treatment decisions.
https://www.carepatron.com/files/bun-creatinine-ratio-chart-sample.pdf
The time required for a ratio chart depends on factors such as the availability of blood test results and data input efficiency. Generally, the process is swift, allowing for timely assessment and intervention in patient care.
Related Templates

Popular Templates