Normal Vital Signs Chart
Enhance patient care with the Normal Vital Signs Chart, with an Abnormal Vital Signs Chart bonus, offering insights into various health issues.

Fact Checked by Ericka Pingol.


What is a Normal Vital Signs Chart?
Normal vital signs are crucial indicators of an individual's overall health, encompassing key parameters of essential body functions such as heart rate (pulse), respiratory rate, blood pressure, and body temperature. These measurements provide valuable insights into the body's essential functions, helping healthcare professionals detect abnormalities, monitor health conditions, and assess the effectiveness of treatments, especially during a medical emergency.
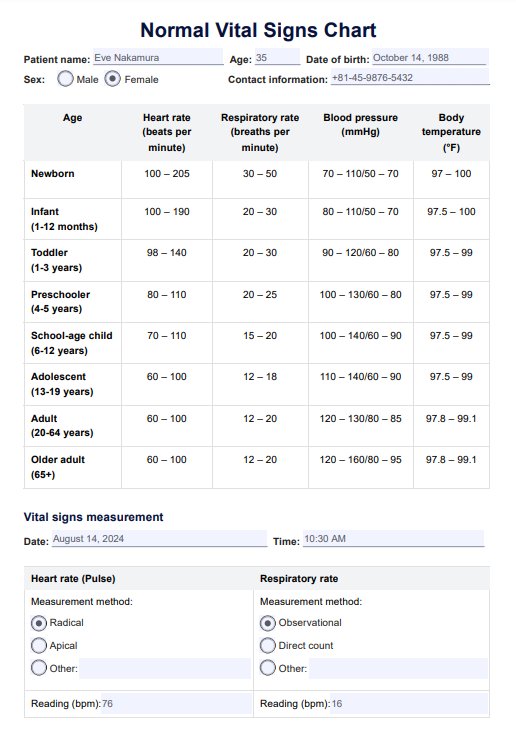
A Normal Vital Signs Chart outlines the accepted ranges for each normal vital sign taken, often categorized by age, gender, and health status. It is a comprehensive tool for healthcare professionals to track vital signs systematically. In a medical setting, it provides a quick reference for healthcare providers. It enhances the precision and consistency of healthcare assessments, contributing to better-informed medical decisions and improved patient care.
Normal Vital Signs Chart Template
Normal Vital Signs Chart Example
How does it work?
Here are the four essential steps to effectively utilize the printable Normal Vital Signs Chart to record and monitor key health indicators during patient assessments:
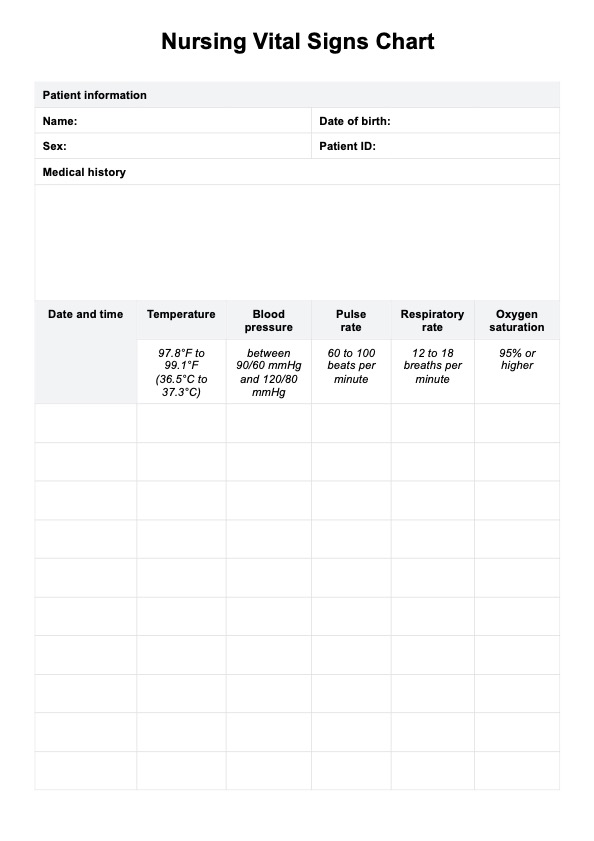
Step 1: Record patient information
Complete the patient's name, gender, and date of birth in the designated spaces on the patient's vital signs record. Ensure accurate details for proper identification.
Step 2: Vital signs measurement
Fill in the date and time of normal vital signs change or sign measurements to establish a chronological record. Use the provided checkboxes and spaces to note the measurement method for each vital sign. Options include radial, apical, observational, direct count, and specific locations for blood pressure. Indicate readings for heart rate (bpm), respiratory rate (breaths per minute), systolic and diastolic blood pressure, and body temperature.
Step 3: Refer to the chart of vital signs
Review the content and values of normal vital signs on the first page. Refer to this information when analyzing the patient's measured vital signs.
Step 4: Additional notes and professional information
Add any relevant comments or remarks about the patient's condition or factors affecting measurements. Healthcare professionals should sign and date the record, validating the accuracy of the documented vital signs.
Who can benefit from this template?
This helpful tool is essential in different healthcare places and situations. This helps them know what's going on with the person's health and helps them get better. Here are the following people who can benefit from this template:
- Primary care doctors and nurses
- Emergency responders
- Specialized cardiology or respiratory care practitioners
- People who take care of others at home
- Educators in medical training programs
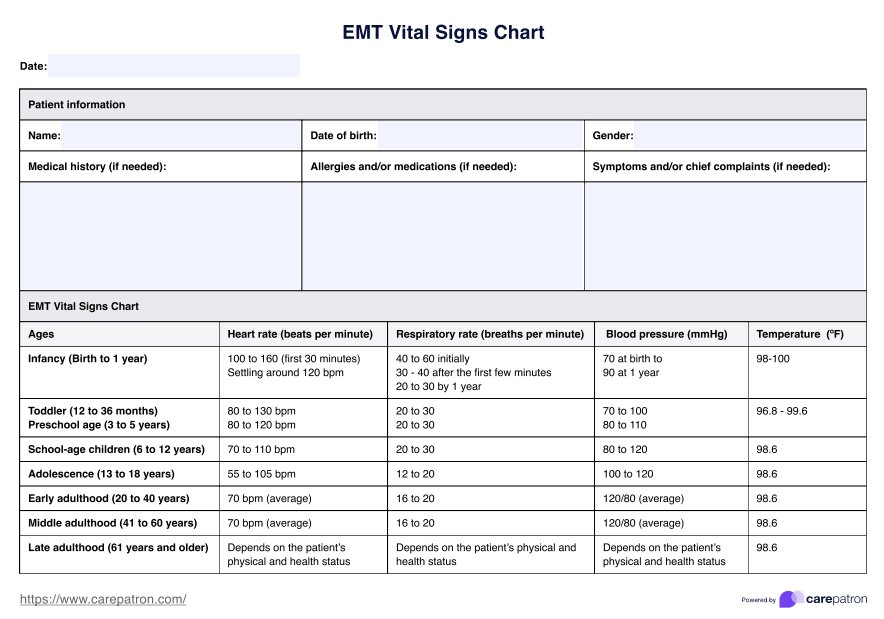
Again, the vital signs chart template ensures that doctors consistently check a person's vital signs, like their heart rate or temperature. Remember that pediatric vital signs, such as normal heart rate, may differ from an adult's.
Abnormal vital signs
While the Normal Vital Signs Chart provides a baseline for typical health indicators, deviations from these norms can signal underlying health issues. When things go wrong, an abnormal vital signs chart can also help doctors figure out how to help patients improve their well-being.
Abnormal vital signs refer to deviations from the typical ranges of critical physiological parameters that are crucial indicators of an individual's health. Variations from normal vital sign ranges or established norms may signal underlying health issues, prompting healthcare professionals to investigate potential causes.
Having a chart on abnormal vital signs helps healthcare providers track and understand changes in vital signs. With this tool, professionals can quickly spot irregularities, understand their meaning, and take appropriate action. It also makes it easier for healthcare providers and workers to give the proper care when vital signs go off track.
What are some things to look out for?
Knowing what's normal for vital signs helps doctors and nurses spot possible problems early and ensure a patient's basic functions. Monitoring changes over time can catch long-term health issues sooner and ensure patients get the proper care to feel better. Here is some salient information to help you understand the results:
Heart rate
A heart rate (pulse) between 60 and 100 beats per minute is generally considered healthy within the normal range, particularly for adolescentes and adults. Typical results include an elevated heart rate (tachycardia), which may indicate stress, anxiety, or cardiovascular issues. Conversely, a slow heart or pulse rate (bradycardia) might be linked to side effects from medication or certain neurological conditions.
Respiratory rate
Abnormal respiratory rates, whether too fast (tachypnea) or too slow (bradypnea), can signal respiratory distress or neurological problems. A normal respiratory rate of 16-20 breaths per minute signifies efficient lung function; higher rates may suggest respiratory distress.
Blood pressure
Both the systolic pressure and diastolic pressure are essential in recording blood pressure. Normal blood pressure falls within the standard 120/80 mm Hg range and reflects healthy vascular function. A blood pressure reading outside this range may denote high blood pressure (hypertension), which is associated with factors like obesity or kidney disease. In contrast, low blood pressure (hypotension) could indicate dehydration or heart failure.
Body temperature
The average body temperature range of 98°F to 98.6°F (36.6°C to 37°C) ensures metabolic processes function optimally. Abnormal body temperature, whether elevated (fever) or decreased (hypothermia), can point to infections, autoimmune disorders, or exposure to extreme conditions.
Commonly asked questions
Healthcare professionals, such as doctors, nurses, and emergency responders, typically request these charts to monitor and assess an individual's health.
These charts are used during medical examinations, emergencies, routine check-ups, and hospitalizations to track and measure blood pressure and analyze key health indicators like heart rate, respiratory rate, blood pressure, and body temperature.
Healthcare professionals use the charts to record and interpret vital signs, helping them detect abnormalities or changes in a patient's health. These charts guide medical decision-making and can be part of routine health assessments.
Related Templates

Popular Templates