Promis Scoring
Introduce a systematic approach to evaluating patient health through the PROMIS measures and learn how to interpret its scores.


What is the PROMIS scale?
The Patient-Reported Outcomes Measurement Information System (PROMIS) is a set of person-centered measures that evaluate and monitor physical, mental, and social health in adults and children. It plays an essential role in clinical practice by offering precise, reliable, and accessible instruments to assess patient-reported health status.
Developed through the National Institutes of Health (NIH), PROMIS’s measures are designed to be relevant for assessing symptoms and functions across all conditions. The system uses item response theory (IRT) for a more comprehensive understanding of a patient's health status (Cella et al., 2007).
The PROMIS scale covers a wide range of health domains, such as physical function, pain, fatigue, emotional distress, and social health. It provides standardized, reliable, and precise measurements that can be used to monitor changes in a patient's health over time. PROMIS measures cover domains including but not limited to:
- Physical Health (e.g., pain, fatigue, sleep disturbance)
- Mental Health (e.g., anxiety, depression, cognitive function)
- Social Health (e.g., ability to participate in social roles and activities)
- Global Health
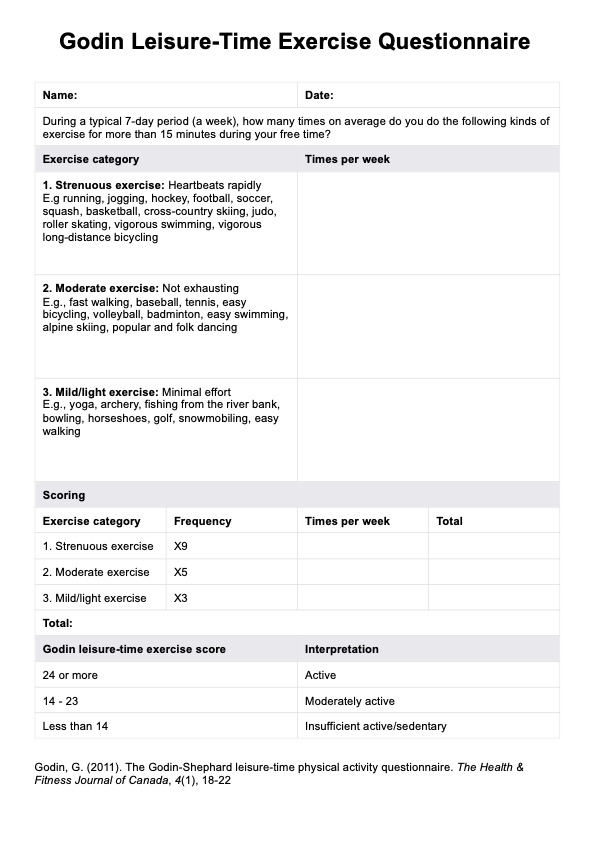
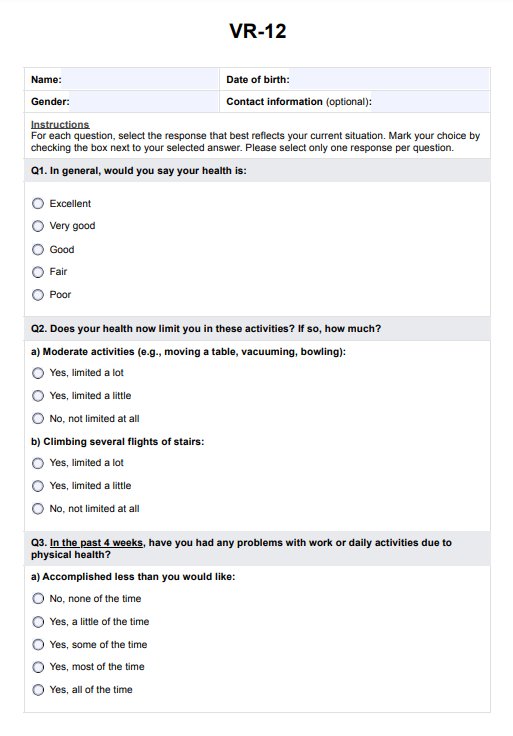
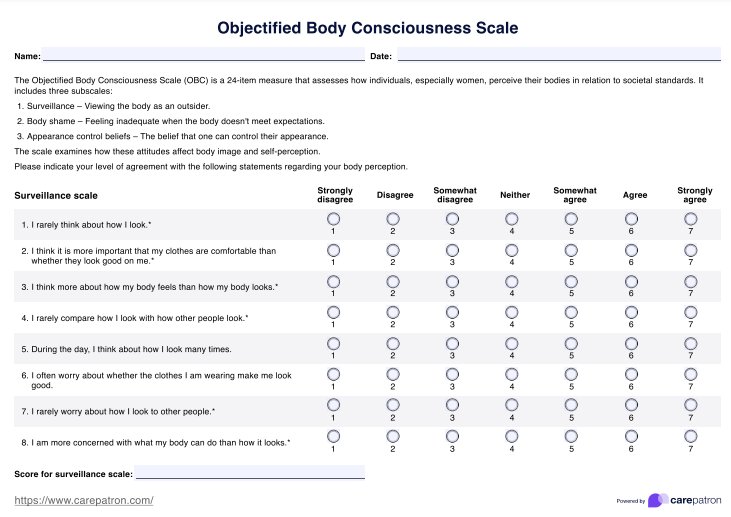
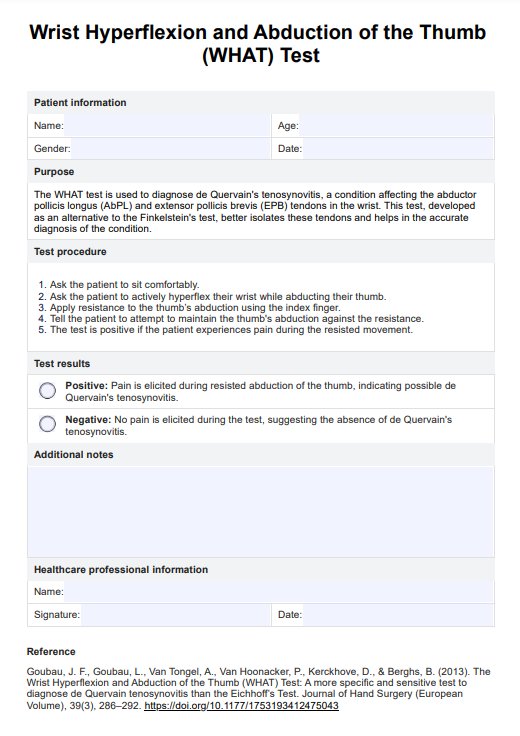
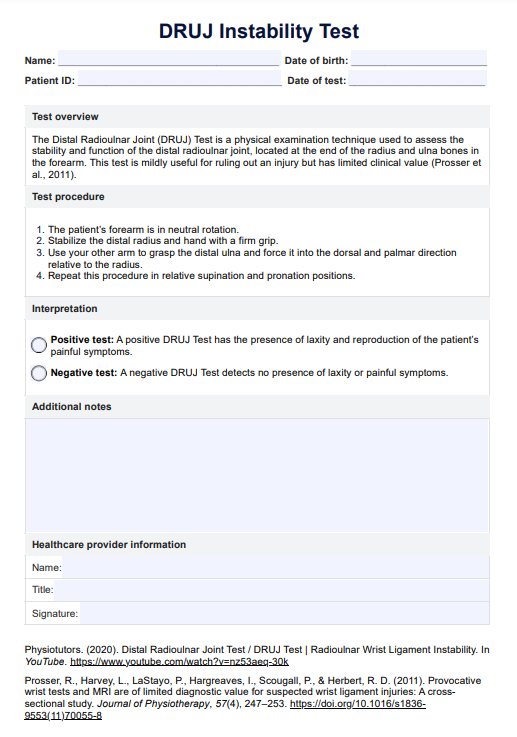
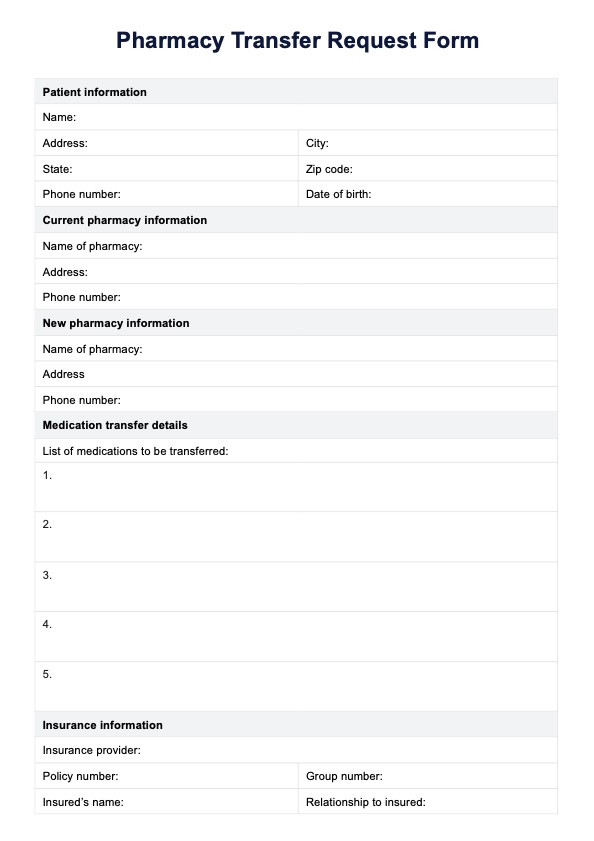
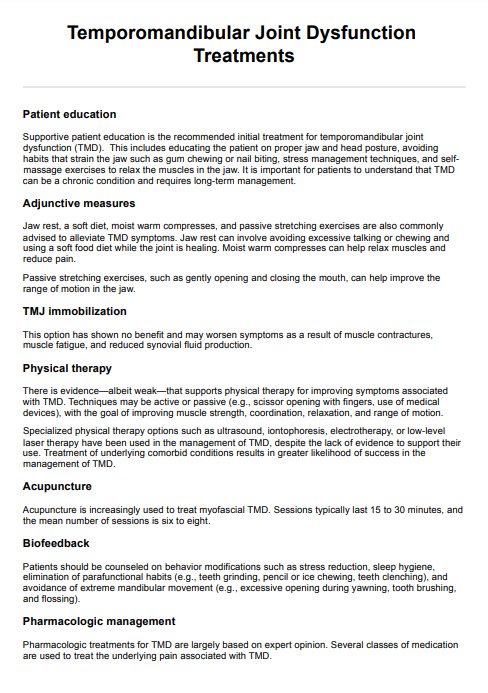
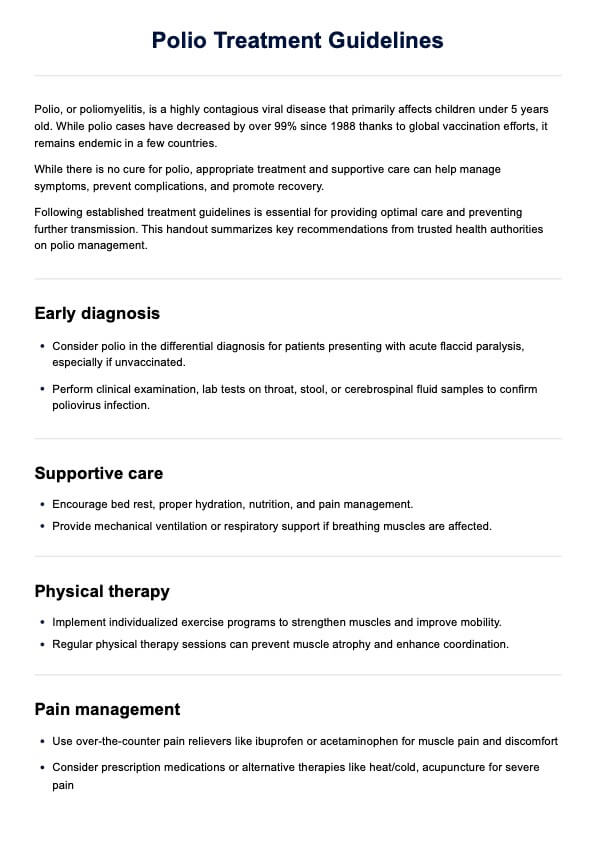
Promis Scoring Template
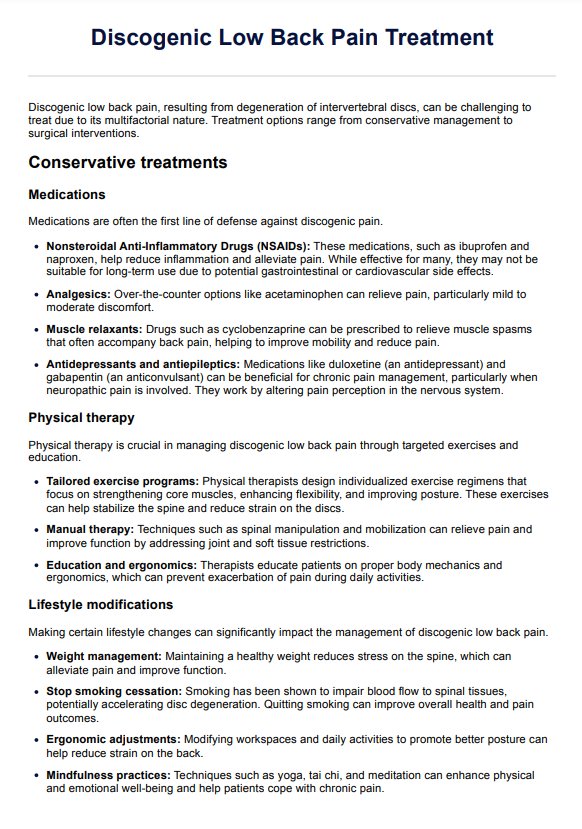
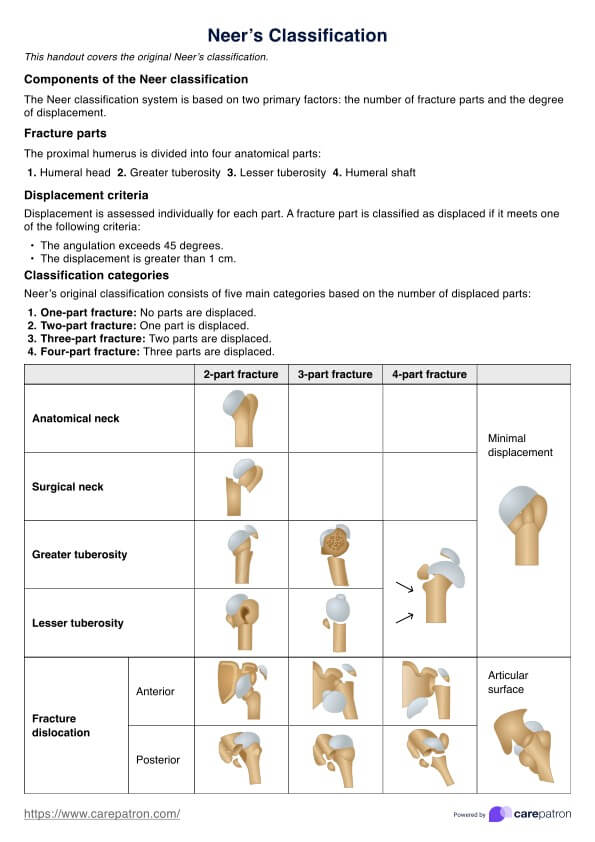
Promis Scoring Example
What is PROMIS Scoring?
PROMIS scoring involves assigning numerical values to patient responses on PROMIS questionnaires to quantify different aspects of their health. Each response is scored based on established algorithms to generate a numerical value representing the patient's health status in a specific domain, such as physical function, pain, fatigue, or emotional well-being. These scores then provide healthcare practitioners with standardized and reliable measurements that can help track changes in a patient's health over time. This can be useful in monitoring treatment effectiveness and enhancing communication between patients and providers.
At the core of PROMIS scoring is the T-score metric. This scoring method uses a standardized metric where 50 represents the average score of a reference population, and each 10-point change corresponds to one standard deviation from that average. This standardized scoring enables easy interpretation and comparison across patients and populations.
How to obtain PROMIS scores
PROMIS has redefined how healthcare practitioners measure patients' health status directly from their perspective. Implementing PROMIS in clinical practice streamlines the capturing of crucial health information and significantly enhances patient-centered care. In this section, we discuss the steps to obtain PROMIS scores more efficiently:
Step 1: Choosing the appropriate PROMIS measure
PROMIS covers a wide range of health domains, including physical function, pain, fatigue, emotional distress, and social roles. The first step involves selecting the domain(s) most relevant to the patient’s health concerns. Consider the patient's primary complaints and the conditions being managed. PROMIS offers both general health assessments and specific measures tailored to particular symptoms or conditions.
Step 2: Administering the assessment
PROMIS assessments can be administered through various methods to suit the clinical setting and the patient’s needs:
- Paper and pencil: Suitable for settings without immediate access to electronic systems.
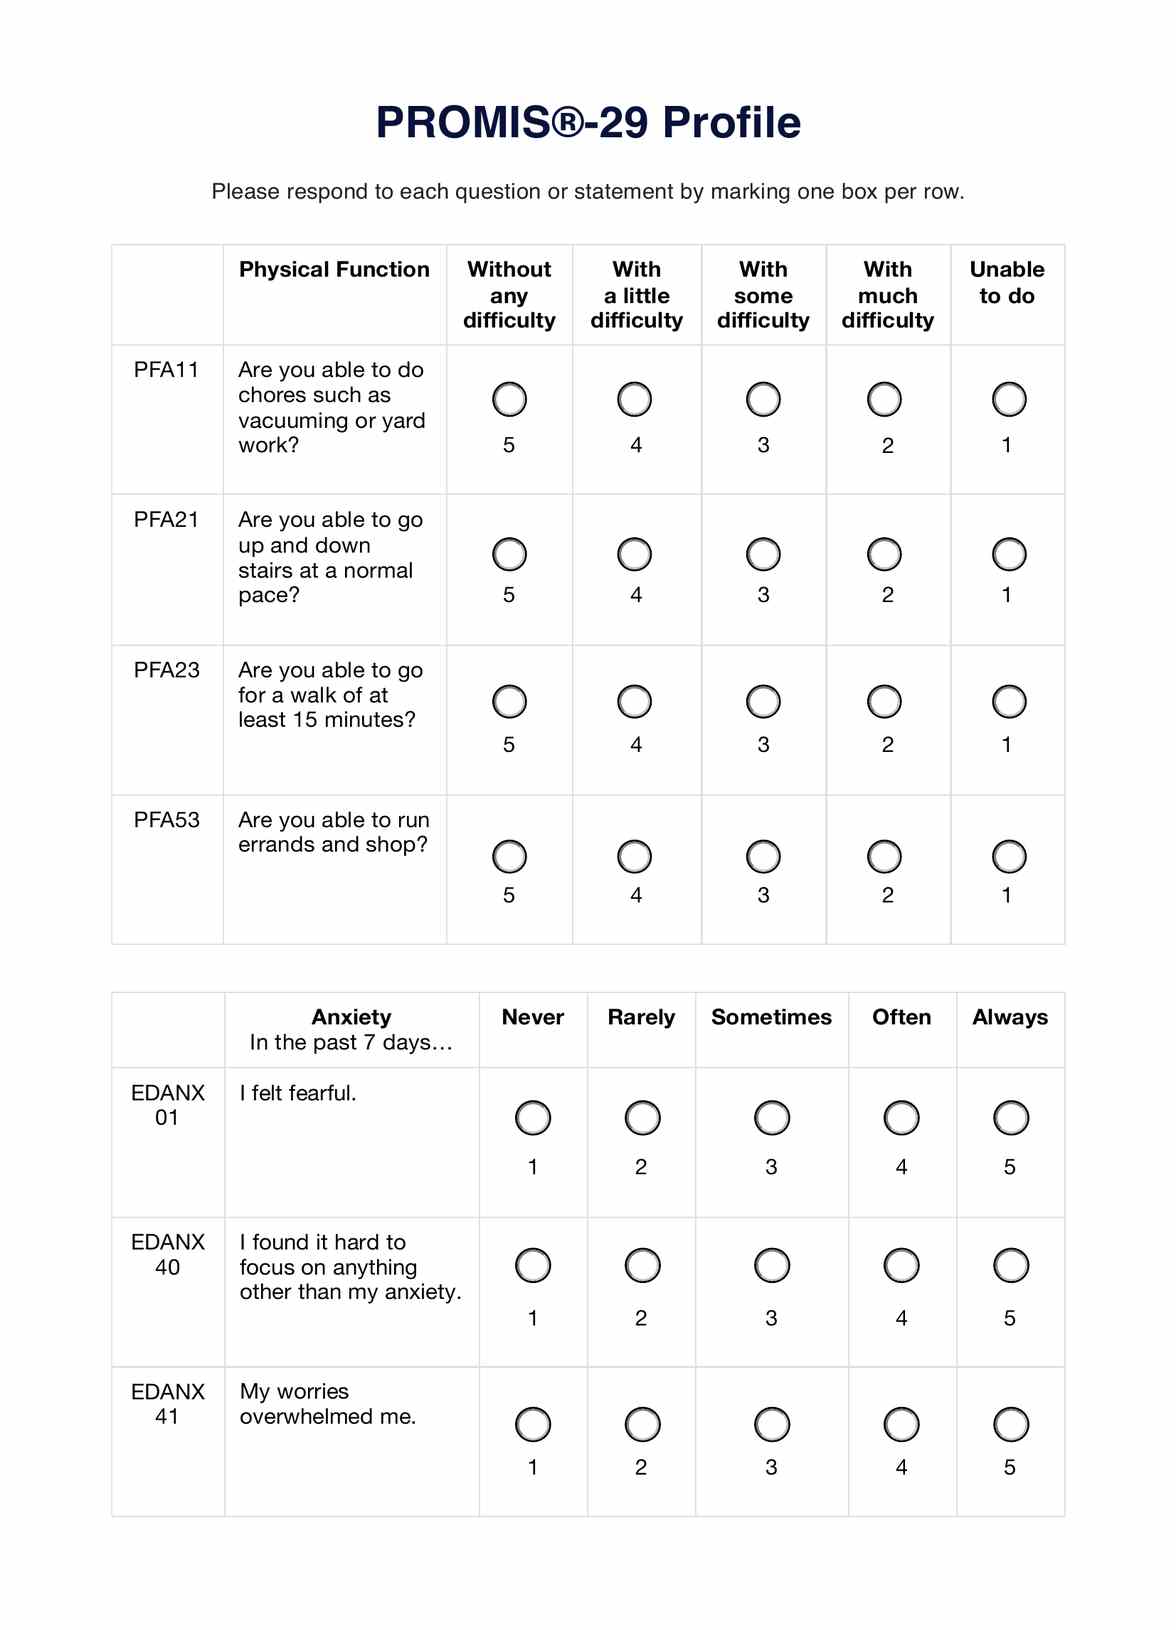
- Electronic administration: Through tablets, computers, or online platforms. Computerized Adaptive Testing (CAT) is available electronically, offering a tailored set of questions based on each response, significantly reducing the number of items needed for precise scoring.
Decide which format is most feasible and comfortable for your practice and your patients. Remember, the goal is to gather accurate data without causing unnecessary burden.
Step 3: Scoring PROMIS measures
The scoring of PROMIS measures depends on the administration format. For paper-based assessments, scoring manuals or guides are available for each measure, allowing for manual calculation. This process involves summing responses according to a scoring key and may vary slightly between different health domains.
For electronic assessments, including CAT, the scoring is automated. The system calculates the T-score in real time based on the patient's responses, immediately providing a precise measure of the health domain assessed.
How to use this template
As an advanced tool for assessing patient-reported outcomes across various health domains, PROMIS scoring allows us to improve the quality of patient care more systematically. Here are the steps to use this template guide to derive PROMIS scores.
Step 1: Administer the PROMIS measures
Once you have identified your objectives in conducting the PROMIS measures and finding those that align with your goals, administer them to your patient. It is important that the patient understands the purpose and importance of their honest responses.
Step 2: Collect and score responses
The scoring will be automated if the assessment is administered electronically, providing immediate results. For paper forms, you must manually score the responses based on the scoring guide for each measure. This process may involve converting raw scores into T-scores to standardize the results for comparative purposes.
Step 3: Refer to the template for interpretation
Interpreting PROMIS scores involves understanding T-scores, where 50 represents the average score based on the general population, and each 10 points represents one standard deviation from the mean. A higher T-score indicates more of the domain being measured. Compare the patient’s scores to a reference group, such as their own demographic population or their scores over time, to assess progress or treatment needs.
Step 4: Apply findings to care plan
Integrating your findings into the patient's care plan is the final and crucial step. Discuss the PROMIS scores with the patient, placing emphasis on areas that require attention. Use these insights to guide treatment decisions, set realistic goals, and monitor the patient’s progress. Additionally, the Care Plan template helps in organizing and tracking patient care activities to ensure comprehensive management and support.
Interpreting PROMIS scores
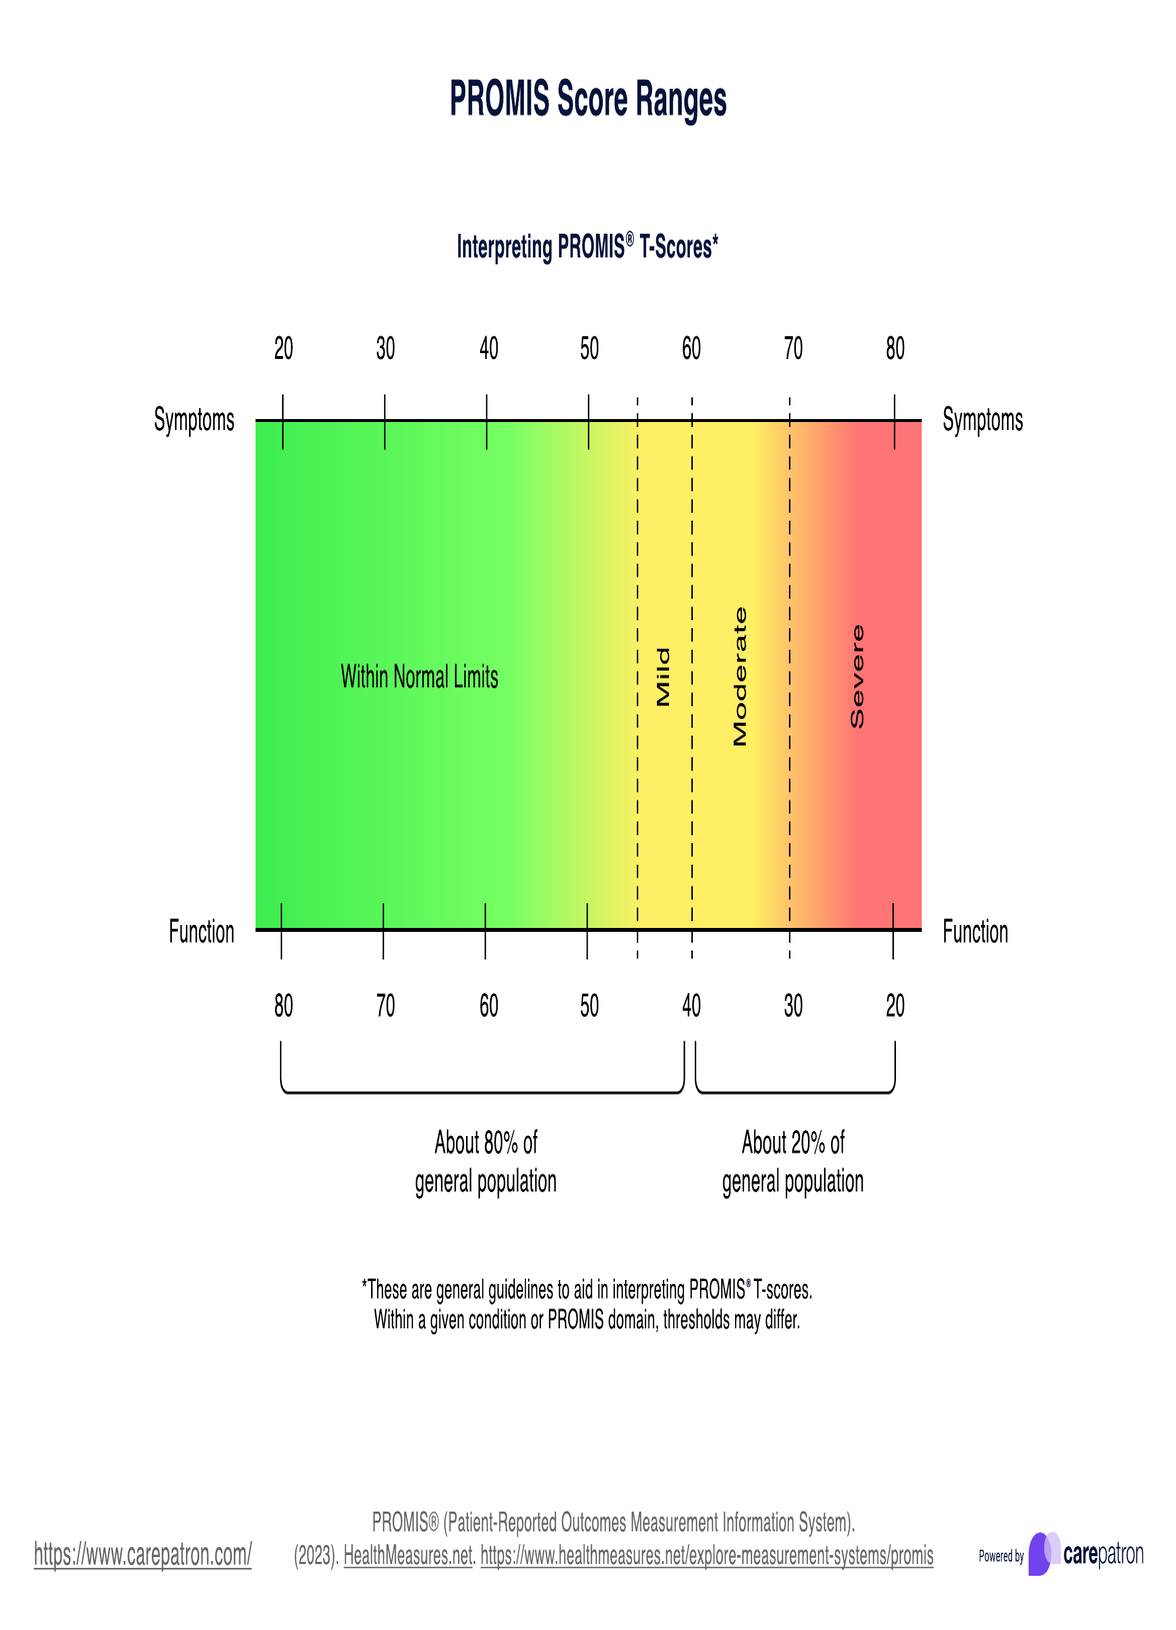
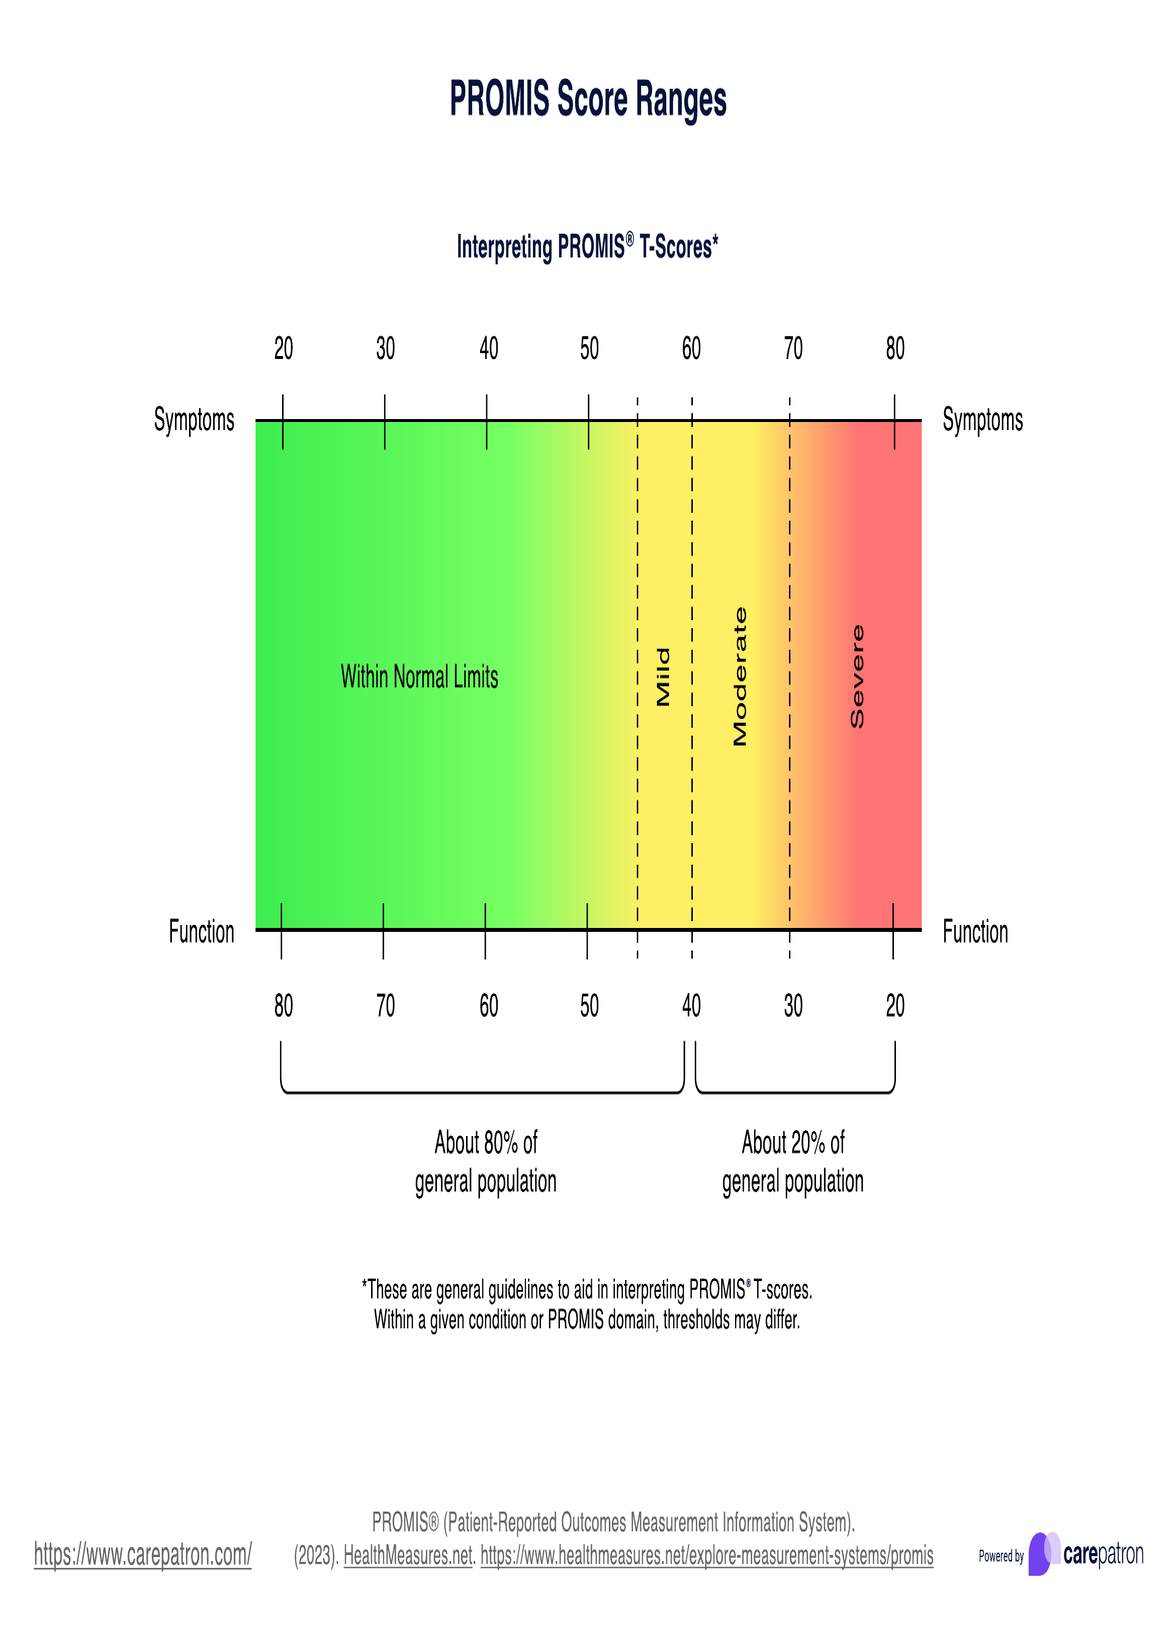
PROMIS utilizes a T-score metric for most of its measures, providing a standardized method in calculating and interpreting patient responses. A T-score of 50 is the reference point, representing the average score of a defined category in a population. This makes it easier to compare an individual's score against a broader, representative group.
Each 10-point deviation from 50 indicates that the patient's scores are one standard deviation away from the population average. You can either measure the symptoms of functions. Scores above 50 can show greater levels of the domain being measured (e.g., better functionality or more severe symptoms), while scores below 50 indicate lower levels. Specifically, we can interpret it this way when measuring symptoms:
- 55-60: Mild symptoms
- 60-70: Moderate symptoms
- 70-80: Severe symptoms
On the other hand, when measuring functionality, we can interpret the T-scores this way:
- 55-40: Mild complications with functionality
- 40-30: Moderate complications with functionality
- 30-20: Severe complications with functionality
Scoring Reminders
When interpreting PROMIS scores, it is important to always keep in mind that they do not exist in a vacuum. It is important to also consider the different contexts of both low and high scores and what they could mean. Here are further reminders when coming up with insights from these scores:
Always contextualize
Interpreting a PROMIS score without context is much like reading a single page of a book and trying to understand the whole story. It lacks depth. Note that high scores in a domain like "Fatigue" is not equivalent to high scores in "Physical Function." While a high score in "Physical Function" may indicate robust health status, a high score in "Fatigue" signals an area for concern and possibly warrants intervention. Always consider the domain being measured to appropriately gauge the implications of a high or low score.
Consider the reference population
PROMIS scores are centered on a reference population—typically the majority of the US general population. Remember that T-scores are evaluated based on this reference group's average responses. A score of 50 represents the average result within the reference population, serving as a benchmark for evaluating individual scores. This comparison to a standardized reference assists in distinguishing between what might be considered typical versus atypical responses based on a broader population’s experience.
Recognize differences among subgroups
Subgroups within your patient population might differ from the general population averages due to factors like age, disease prevalence, or cultural differences. Taking the norms of these groups into account can provide a more accurate interpretation of PROMIS scores for specific patient populations, allowing for more customized patient care.
Use scores to track changes over time
The dynamic nature of health status is captured through longitudinal tracking of PROMIS scores. Regular assessment can measure the impact of interventions and provide early signals of change in a patient's condition. Whether reflecting improvements or indicating potential setbacks, these temporal patterns are helpful information when managing patient health.
Reference
Cella, D., Yount, S., Rothrock, N., Gershon, R., Cook, K., Reeve, B., Ader, D., Fries, J. F., Bruce, B., & Rose, M. (2007). The patient-reported outcomes measurement information system (PROMIS). Medical Care, 45(Suppl 1), S3–S11. https://doi.org/10.1097/01.mlr.0000258615.42478.55
Commonly asked questions
The PROMIS Physical Function (PF) is scored using a T-score metric, which is derived from the responses provided by the patient. Each item's response is given a score, and these scores are summed and then converted into a T-score through a process that accounts for the question's difficulty and the calibration of the measure. This conversion often involves software or scoring tables specific to the PROMIS framework.
In PROMIS, a T-score metric represents a person's health status compared to a reference population with a mean (average) score of 50 and a standard deviation (SD) of 10. A T-score higher than 50 suggests better health status or function compared to the average, while a T-score below 50 indicates poorer health status or function.
A T-score metric is a standardized score that indicates where a person's score falls on a distribution relative to a reference population's mean and standard deviation. On the other hand, a percentile shows the percentage of the reference population that scores below a particular score. T-scores provide a direct comparison to the population mean and variability, while percentiles tell you the position of a score in relation to others in the population.


