A1C Goals By Age Chart
Use our free A1C Goals by Age Chart to learn the recommended A1C goals for people of different ages. Download our free PDF and example here.

Fact Checked by RJ Gumban.


Understanding A1C levels and goals
The Hemoglobin A1c (HbA1c) Test, often called the A1C test, is a blood test that provides a snapshot of an individual's average blood sugar control over the past 2-3 months. It's a crucial tool for both diagnosing and managing diabetes.
The importance of A1C goals in developing diabetes also extends beyond diagnosing diabetes. Maintaining healthy blood sugar levels, even within the prediabetes range, can significantly reduce the risk of developing full-blown diabetes and its associated complications. Furthermore, managing A1C levels is crucial for pregnant women to minimize risk factors during pregnancy and birth.
The substantial economic burden of diabetes underscores the importance of preventive measures and proactive healthcare strategies. In the United States alone, the total annual cost of diabetes in 2022 amounted to a staggering $412.9 billion. This breaks down to $306.6 billion in direct medical expenses and a hefty $106.3 billion in indirect costs (American Diabetes Association, 2023).
Understanding a patient's A1C level allows healthcare professionals to diagnose diabetes mellitus, set personalized goals, take proactive steps to manage their blood sugar, and lower their risk of chronic health problems.
A1C Goals By Age Chart Template
A1C Goals By Age Chart Example
What is an A1C Goals by Age Chart?
A1C levels offer a valuable long-term view of a patient's average sugar in their red blood cells. However, for effective diabetes management, understanding individualized A1C goals is crucial. This is where the A1C Goals by Age Chart becomes a powerful tool for healthcare professionals.
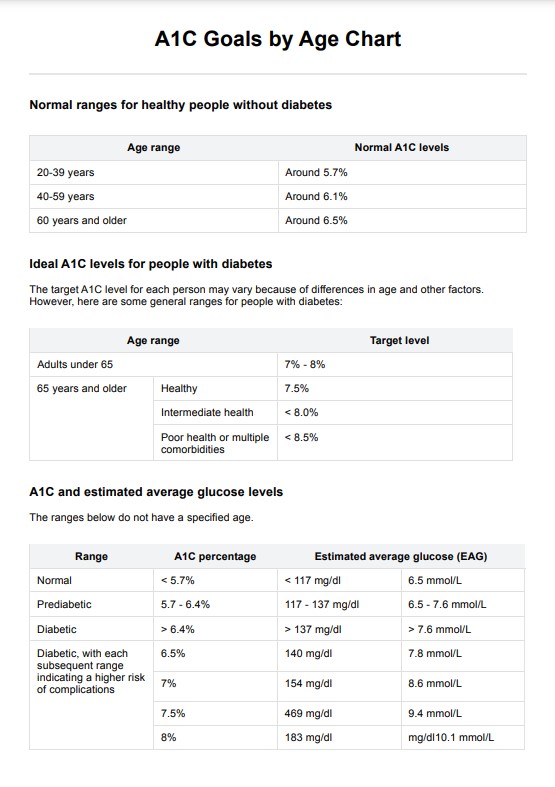
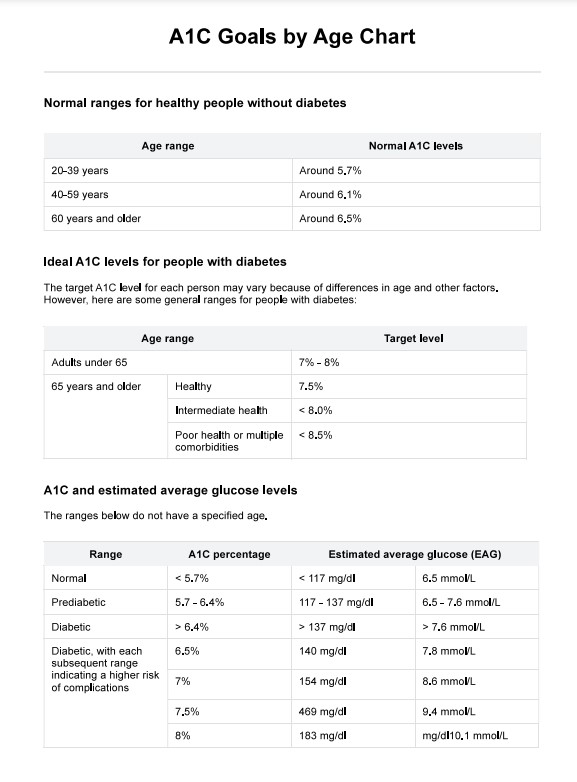
The A1C Goals by Age Chart is a reference for recommended A1C goals, often presented as estimated average glucose (eAG) blood sugar levels for various age groups. It's important to emphasize to patients that these are general guidelines. Several factors influence individual target A1C levels, and consulting with you is essential to establish personalized goals based on their unique health profile.
According to the American Diabetes Association (2023), the typical target A1C level for adults is around 7%, corresponding to an average blood sugar level of 126 mg/dL. However, this may need to be adjusted based on individual circumstances. For children and teenagers, the target is often below 7%. This translates to a daily average blood sugar of less than 126mg/dL.
Consider various factors when establishing a patient's personalized A1C goals, such as overall health status, presence of commodities, and type of diabetes (if applicable).
How does an A1C Goals by Age Chart work?
Our free printable A1C chart provides a helpful visual guide to what A1C levels are normal for different age groups. It also provides ranges of ideal and recommended blood glucose control. You can use this template by following the steps below:
Step 1: Access the free worksheet
Click the "Use template" button to open a customizable chart on the Carepatron app. You can also click "Download" to save a non-customizable but fillable version onto your device.
Step 2: Determine your patient's age range
Look at the normal A1C by age chart to determine which age range your patient falls into. Depending on what it says, the ideal A1C goal may be different.
Step 3: Analyze the results
Once you've determined the patient's age range, look at the chart to see their ideal A1C goal. Create a plan with your patient to help them reach their ideal A1C levels based on the blood sample.
Step 4: Track progress
Keep track of your patient's progress. Carepatron can help you monitor A1C levels. Our software allows you to easily track and analyze your patients' data to adjust their treatment plans as needed quickly.
When would you use this A1C Goals by Age Chart?
You can use our free printable A1C Chart to help you monitor and guide your patient's treatment and prevent further diabetes complications. You can also utilize this to:
Make more informed decisions about your patient's diabetes treatment plans
An A1C test or the hgba1c chart can help you determine the appropriate goals for diabetes medication for your patient's age and health. This can help keep your patient motivated and on track with their diabetes treatment plan.
Help your patient better understand the importance of blood sugar control
This chart is a great way to make your patient understand what an ideal A1C target should be and why it matters. With this chart, you and your patient can avoid diabetes risk factors, in turn avoiding low blood sugar episodes and high blood sugar episodes.
Keep track of your patient's diabetes progress
The hgba1c chart is also a great way to monitor your patient's progress toward their diabetes control goals. With this chart, you can quickly monitor the changes in their A1C levels over time to ensure they stay on track with their diabetes management plan.
Benefits of free A1C Goals by Age Chart
This free A1C Goals by Age Chart is a valuable tool for healthcare professionals and patients conducting blood tests for sugar levels. Here are some of its benefits:
- It's entirely digital: You can access this chart anywhere at your clinic or home. This makes it incredibly accessible for busy patients and healthcare providers.
- It's easy to use: The chart's layout is straightforward, making it simple for healthcare professionals and patients to read and interpret.
- It helps identify patterns: The chart allows you to track changes in A1C levels over time, which can provide valuable insights into the underlying causes of diabetes. This data can then be used to customize treatment plans for each patient's needs.
- It helps patients stay motivated: Seeing apparent changes in their A1C levels over time can be a powerful motivator for diabetes patients. The chart can also provide helpful feedback to those trying to stay on top of their diabetes management.
It is essential for people with diabetes to regularly check their blood glucose levels, as this will help ensure that their A1C levels remain within the recommended range. In addition, regular physical activity and healthy eating can help a person maintain their blood glucose level under control and thus keep their A1C levels under control.
References
American Diabetes Association. (2023, November 1). New American Diabetes Association report finds annual costs of diabetes to be $412.9 billion. https://diabetes.org/newsroom/press-releases/new-american-diabetes-association-report-finds-annual-costs-diabetes-be
Commonly asked questions
A normal hemoglobin A1C (HbA1C) level for a person without diabetes is below 5.7%. Levels between 5.7% and 6.4% indicate prediabetes, while an A1C of 6.5% or higher suggests diabetes, highlighting the importance of regular screening to detect potential glucose metabolism issues early
Yes, A1C levels tend to increase with age due to various physiological changes, including decreased insulin sensitivity and alterations in glucose metabolism. The normal range for A1C can rise slightly as individuals age, reflecting metabolic shifts, even among those without diabetes.
The American Diabetes Association's new guidelines for A1C levels emphasize individualized targets based on a person's age, health status, and duration of diabetes. Generally, a target A1C of less than 7% is recommended for most adults with diabetes, while older adults or those with significant comorbidities may have higher targets, such as 7.5% to 8.5%, to minimize the risk of hypoglycemia and complications.
Related Templates

Popular Templates