Normal Ejection Fraction By Age Chart
Optimize heart health with our Normal Ejection Fraction By Age Chart. Understand cardiac function based on age-specific norms. Download your PDF guide now.

Fact Checked by RJ Gumban.


What is a Normal Ejection Fraction by Age Chart?
A Normal Ejection Fraction by Age Chart is a graphical representation or table that outlines the expected range of ejection fraction values for different age groups. Ejection fraction refers to the percentage of oxygen-rich blood pumped out of the heart with each contraction and is a crucial measure of heart function (Kosaraju et al., 2024). This chart is a valuable clinical tool, aiding healthcare professionals in evaluating cardiac performance and diagnosing conditions like heart failure.
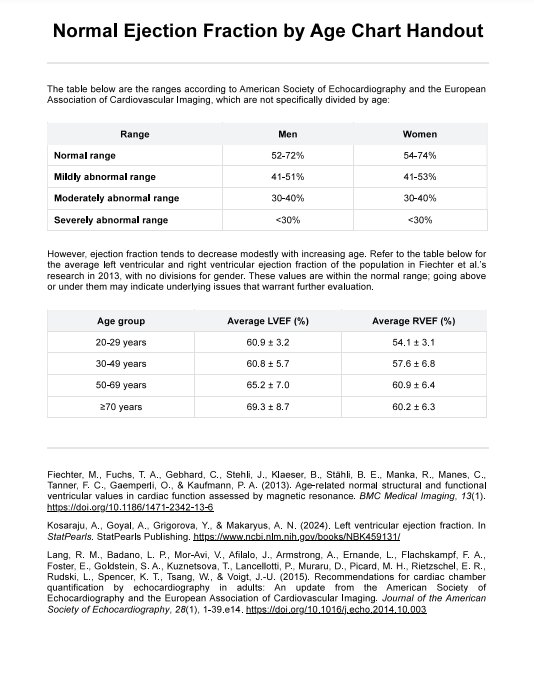
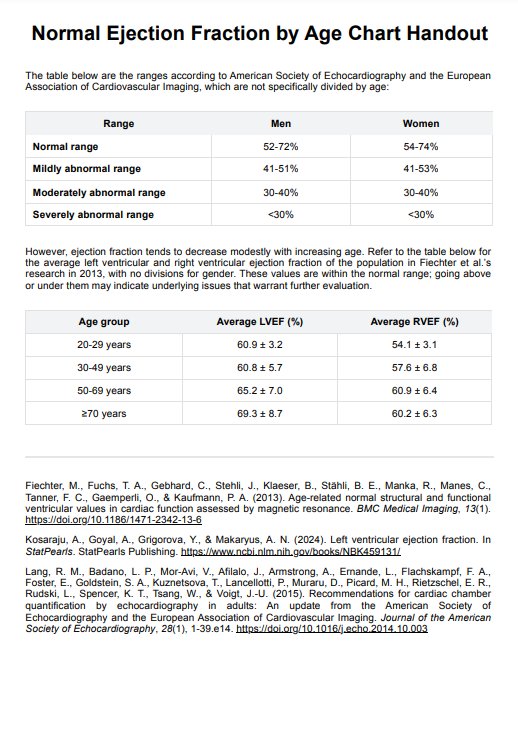
A normal ejection fraction typically falls between 52-72% for male adults and 54-74% for female adults, indicating efficient heart function (Lang et al., 2015). Our template includes a chart that breaks down this normal range across various age brackets based on Fiechter and colleagues' 2013 research, recognizing that acceptable values may vary. This chart is essential for interpreting individual ejection fraction measurements in the context of age-related norms.
This resource is vital not only for medical professionals but also for individuals at risk of heart-related issues. Patients with high blood pressure or who have experienced heart attacks, strokes, or other cardiac conditions can use the chart to monitor changes in their heart function. By understanding their baseline ejection fraction and recognizing deviations, individuals can proactively engage with healthcare providers to address potential concerns and optimize cardiac health.
Our template attempts to fulfill both the need for a reference and a patient chart by providing both in one template.
Normal Ejection Fraction By Age Chart Template
Normal Ejection Fraction By Age Chart Example
How does it work?
Using our Normal Ejection Fraction by Age Chart template involves a straightforward process that aids healthcare professionals and individuals in assessing heart function. Here's a breakdown of the steps involved:
Step 1: Access the template
Click "Use Template" to open the template in the free Carepatron app, where you can customize it to add fields or your practice's name and details. Alternatively, you can open the printable PDF version by clicking "Download." The template contains two parts: a handout that can serve as a reference and a patient chart for documenting information. Depending on your needs, you may choose to print out only one part or both.
Step 2: Measurement of ejection fraction
Use diagnostic tools such as echocardiography, cardiac MRI, or radionuclide ventriculography to measure ejection fraction of individuals undergoing cardiac assessment. The values are presented in percentage terms, indicating the expected efficiency of the heart's pumping function.
Step 3: Compare with gender and age group normal values
Identify the gender and age group of the individual for whom the ejection fraction is being assessed. The first table of the handout is categorized into genders, and the ranges are normal, mildly abnormal, moderately abnormal, and severely abnormal. These ranges are for the whole population regardless of age. The second table provides the normal ejection fraction range for each age group.
Step 4: Interpretation and diagnosis
Interpret the ejection fraction measurement in the context of the chart. Values within the specified normal range indicate healthy heart function, while deviations may suggest potential cardiac issues. The template's patient chart has a section for documenting measured values and symptoms in case the patient has heart failure with preserved ejection fraction (HFpEF), also known as diastolic heart failure.
Step 5: Monitoring and follow-up
Regular monitoring is crucial for individuals with a history of heart conditions or at risk of heart failure. The handout can be used as a reference for tracking changes in ejection fraction over time, prompting timely medical intervention if needed. Patients must communicate with their healthcare providers about deviations from the norm, potential risk factors, and proactive measures for heart health, contributing to personalized care.
When would you use this chart?
The Normal Ejection Fraction by Age Chart is a valuable resource for healthcare practitioners, particularly in cardiology, providing a structured reference for assessing heart function across different age groups. Here are scenarios in which this chart proves essential:
- Cardiac evaluation: Cardiologists and cardiovascular specialists use the chart to interpret ejection fraction measurements during routine cardiac evaluations. It aids in diagnosing and monitoring heart conditions, such as heart failure and coronary artery disease.
- Diagnosis of heart failure: When patients present with symptoms suggestive of heart failure, such as shortness of breath or fatigue, healthcare practitioners refer to the chart to assess whether ejection fraction values fall within the normal range.
- Risk stratification: Primary care physicians and specialists may use the chart to stratify the risk of heart failure in individuals with a history of cardiovascular events, such as heart attack or strokes. It helps identify those who may benefit from closer monitoring.
- Treatment planning: Cardiac surgeons and interventional cardiologists consider ejection fraction values when planning interventions or surgeries. The chart provides a baseline for determining the appropriateness of specific procedures.
- Long-term management: General practitioners and healthcare providers involved in long-term patient care use the chart to manage individuals with known heart conditions. Regular comparisons assist in tracking changes and adjusting treatment plans accordingly.
- Patient education: Healthcare educators use the chart to facilitate patient understanding. It serves as a visual aid during discussions about heart health, helping individuals comprehend the significance of ejection fraction values in the context of their age.
- Preventive care: Individuals with risk factors for heart disease, such as hypertension or diabetes, can benefit from the chart during preventive health check-ups. This proactive approach allows for early detection of potential cardiac issues.
What do the charts mean?
Interpreting the results of an ejection fraction measurement, in alignment with a Normal Ejection Fraction by Age Chart, provides valuable insights into heart function. The tables in the handout convey information about the efficiency of the heart pumping blood, aiding in assessing cardiovascular health. Here's what common results may indicate:
- Normal range: Results in this range suggest that the heart effectively pumps blood out of the left ventricle with each contraction. This indicates good cardiac function, and individuals within this range generally have a lower risk of heart valve disease and other heart-related issues.
- Mildly abnormal range: Low ejection fraction values indicate reduced pumping efficiency. This could indicate early-stage heart dysfunction, and healthcare providers may recommend additional tests to identify potential causes.
- Moderately abnormal range: A moderately reduced ejection fraction may suggest mild to moderate impairment in heart function. While individuals in this range may not exhibit severe symptoms, close monitoring, and lifestyle modifications may be recommended to prevent further decline.
- Severely abnormal range: Severe reduction in ejection fraction indicates significant impairment in pumping function. This is often associated with advanced heart failure and may require more aggressive interventions, such as medications, lifestyle changes, or, in severe cases, surgical procedures.
The second table displays the normal ranges for each age group. All these ranges fall within the normal range; they are simply a more specific norm for each age group. If a patient's measured ejection fraction falls outside the range for their age but is still within the normal range for adults, it is still not a cause for immediate concern but may still warrant further investigation and analysis.
While an ejection fraction above the normal range might not always be cause for concern, values excessively above normal could be associated with conditions like hypertrophic cardiomyopathy. Further evaluation is necessary to determine the underlying cause and assess overall heart health.
References
Fiechter, M., Fuchs, T. A., Gebhard, C., Stehli, J., Klaeser, B., Stähli, B. E., Manka, R., Manes, C., Tanner, F. C., Gaemperli, O., & Kaufmann, P. A. (2013). Age-related normal structural and functional ventricular values in cardiac function assessed by magnetic resonance. BMC Medical Imaging, 13(1). https://doi.org/10.1186/1471-2342-13-6
Kosaraju, A., Goyal, A., Grigorova, Y., & Makaryus, A. N. (2024). Left ventricular ejection fraction. In StatPearls. StatPearls Publishing. https://www.ncbi.nlm.nih.gov/books/NBK459131/
Lang, R. M., Badano, L. P., Mor-Avi, V., Afilalo, J., Armstrong, A., Ernande, L., Flachskampf, F. A., Foster, E., Goldstein, S. A., Kuznetsova, T., Lancellotti, P., Muraru, D., Picard, M. H., Rietzschel, E. R., Rudski, L., Spencer, K. T., Tsang, W., & Voigt, J.-U. (2015). Recommendations for cardiac chamber quantification by echocardiography in adults: An update from the American Society of Echocardiography and the European Association of Cardiovascular Imaging. Journal of the American Society of Echocardiography, 28(1), 1-39.e14. https://doi.org/10.1016/j.echo.2014.10.003
Commonly asked questions
A normal ejection fraction (EF) generally ranges from 52-72% for male adults and 54-74% for female adults regardless of age, though slight increases are observed in older age groups.
Heart failure is typically indicated when the ejection fraction falls below 40%, with severe heart failure occurring at an EF below 30%.
Our handout and patient chart can be used during cardiac evaluations, preventive health check-ups, and assessments of individuals presenting with symptoms like shortness of breath or fatigue. They are also employed in long-term management for tracking changes in ejection fraction over time.
Healthcare providers use the charts to interpret ejection fraction measurements obtained through diagnostic tools like echocardiography, cardiac MRI, or radionuclide ventriculography. The charts in our handout guide the assessment of cardiac function by comparing individual sizes to the expected normal range based on age, while the patient charts in our template has fillable fields for recording data.
The time to use a Normal Ejection Fraction By Age Chart varies. Healthcare professionals can quickly refer to the charts in the handout during patient consultations for immediate interpretation in clinical settings. The time spent on measuring the patient ejection fraction, filling out their chart, and analyzing the data may take 15 minutes to an hour depending on the individuals involved.
Related Templates

Popular Templates