Glucose Levels
Track and manage your blood sugar effectively with Carepatron’s Glucose Levels Chart—a comprehensive guide for optimal diabetes care and informed decisions.
.jpg)
Fact Checked by Ericka Pingol.


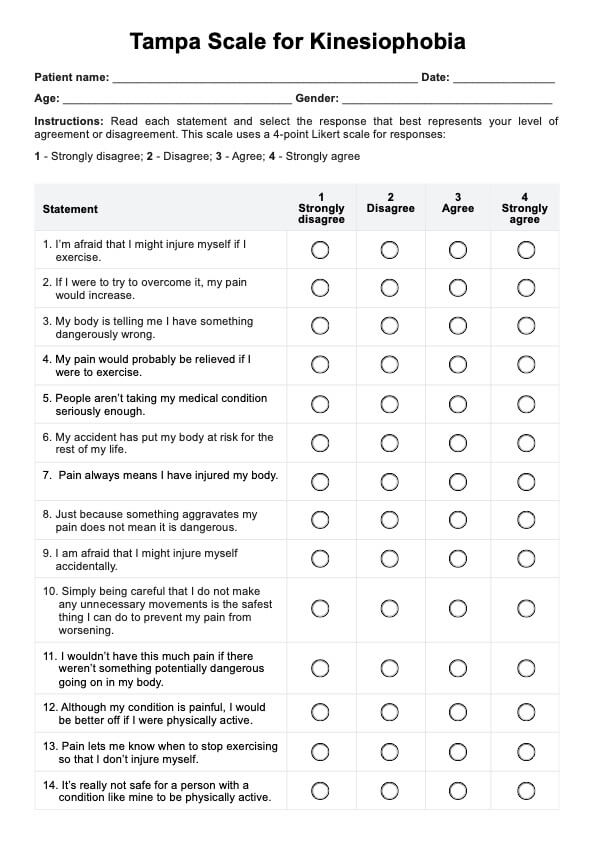
What is a Glucose Levels Chart?
A Glucose Levels Chart is an instrumental visual aid designed to depict the fluctuations and patterns of blood sugar levels within the human body. Serving as a cornerstone for diabetes management, this chart is crucial for individuals diagnosed with diabetes and the healthcare professionals assisting them.
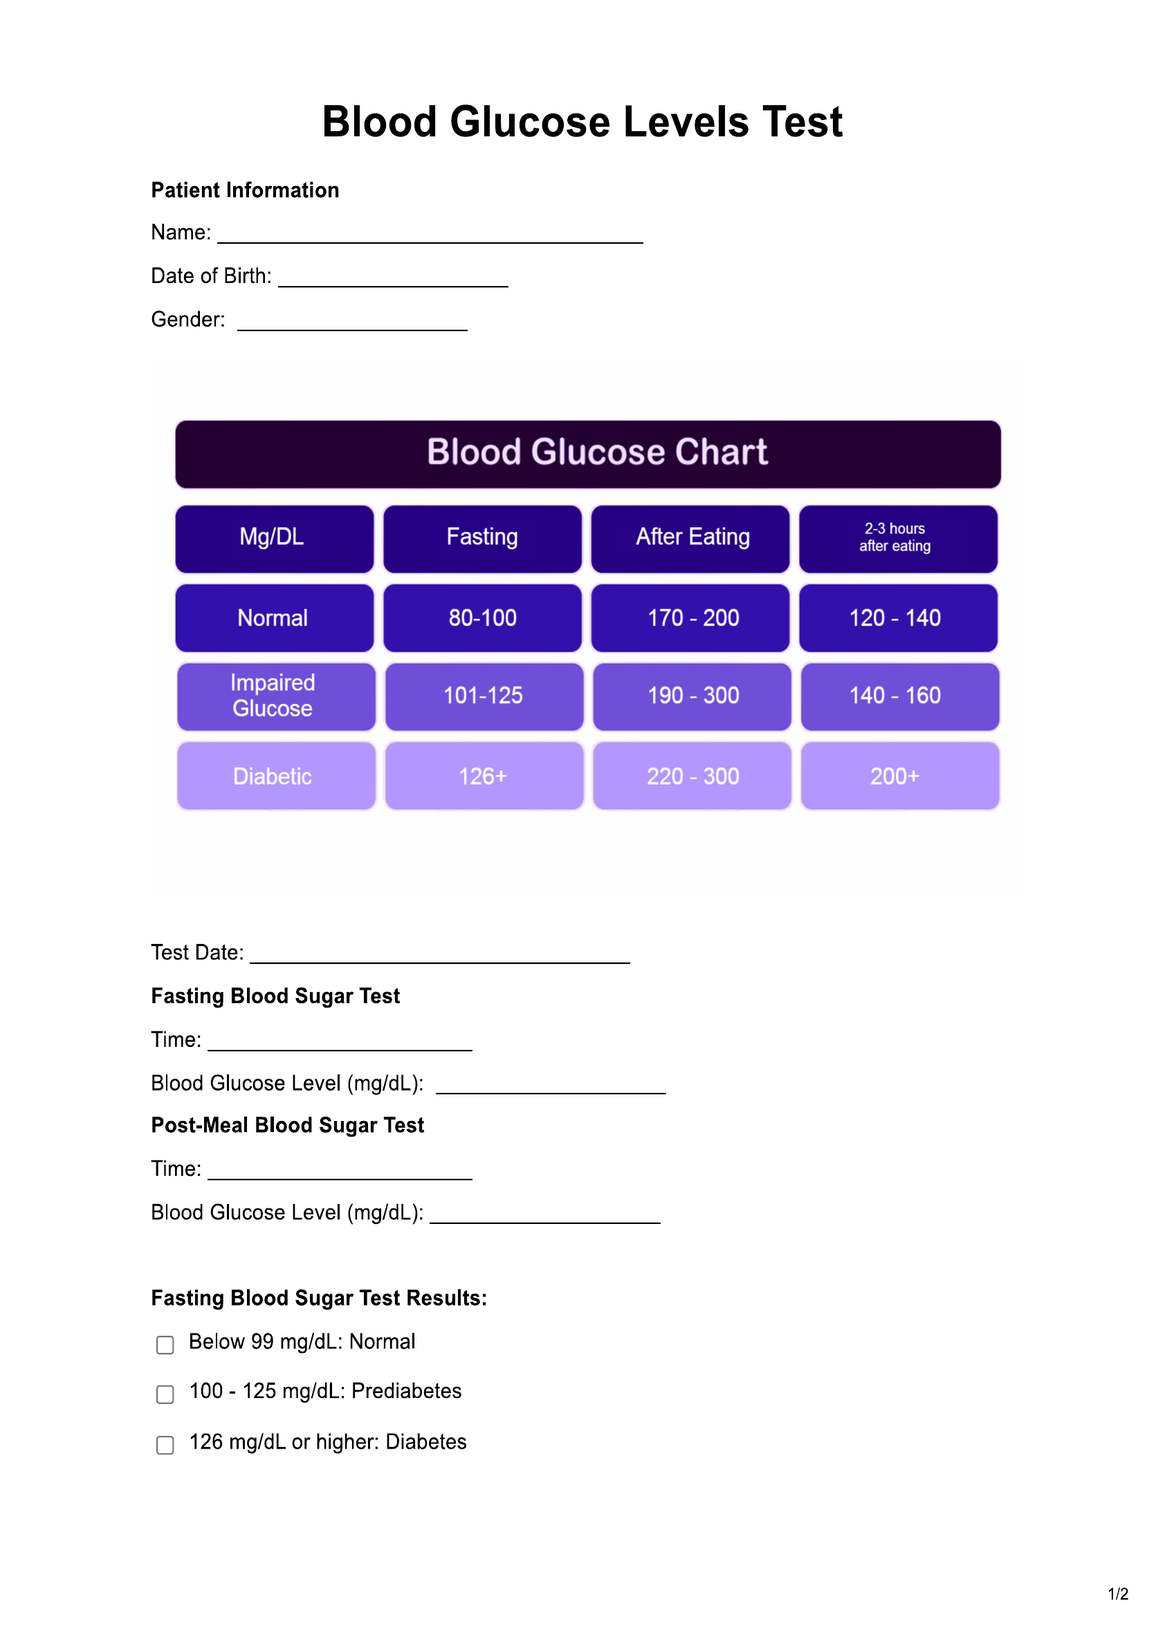
The chart systematically segregates glucose readings into distinct categories, such as low, normal, and elevated levels. These divisions can be further refined, considering variables like age, specific times of the day (e.g., fasting or post-prandial), and unique circumstances like pregnancy.
The primary purpose of the chart is to provide clarity. By mapping out glucose levels, it becomes easier to discern the effects of various external factors, be it dietary habits, physical activities, or medication intake. Such a detailed breakdown not only facilitates a deeper understanding of one's health but also aids in proactive decision-making.
For instance, recognizing consistent anomalies in the chart can prompt timely medical consultations and necessary adjustments in treatment plans. The Glucose Levels Chart is more than just a tool; it's a comprehensive guide that fosters awareness, encourages proactive health management, and ultimately aims to improve the quality of life for those navigating the complexities of diabetes.
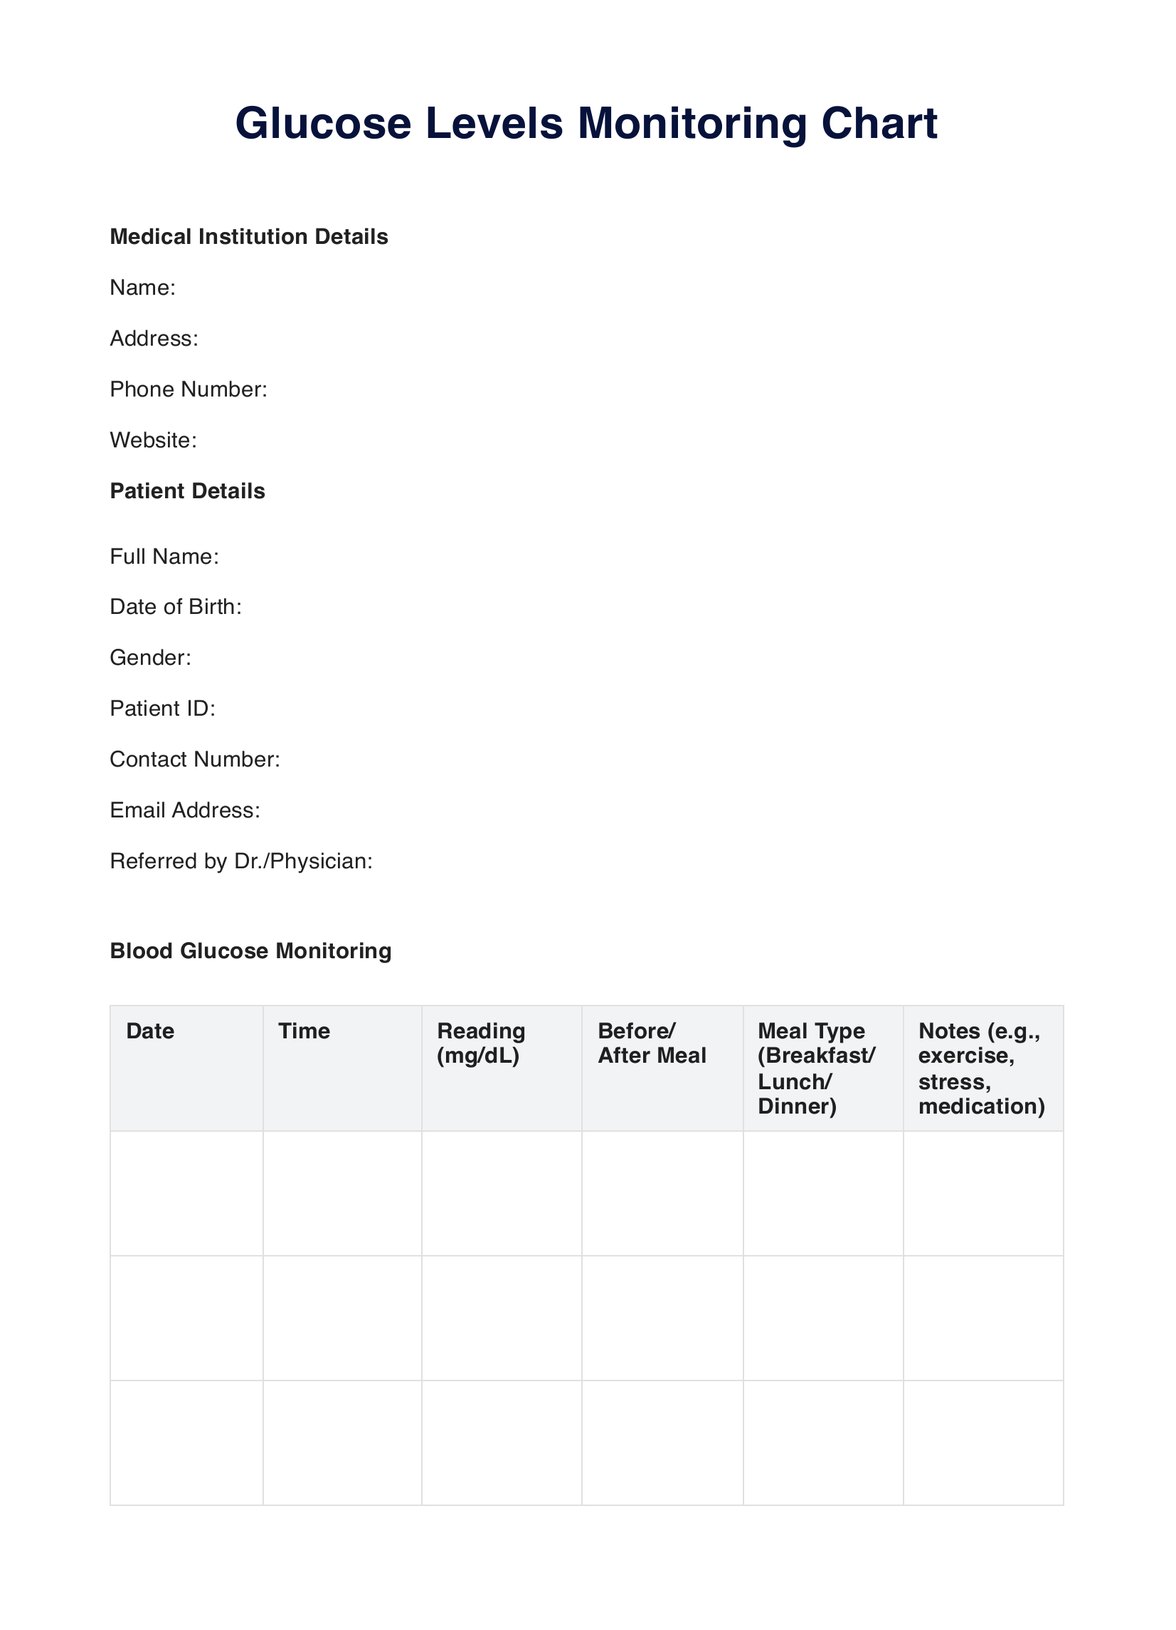
Glucose Levels Template
Glucose Levels Example
How does it work?
Initialization and Setup
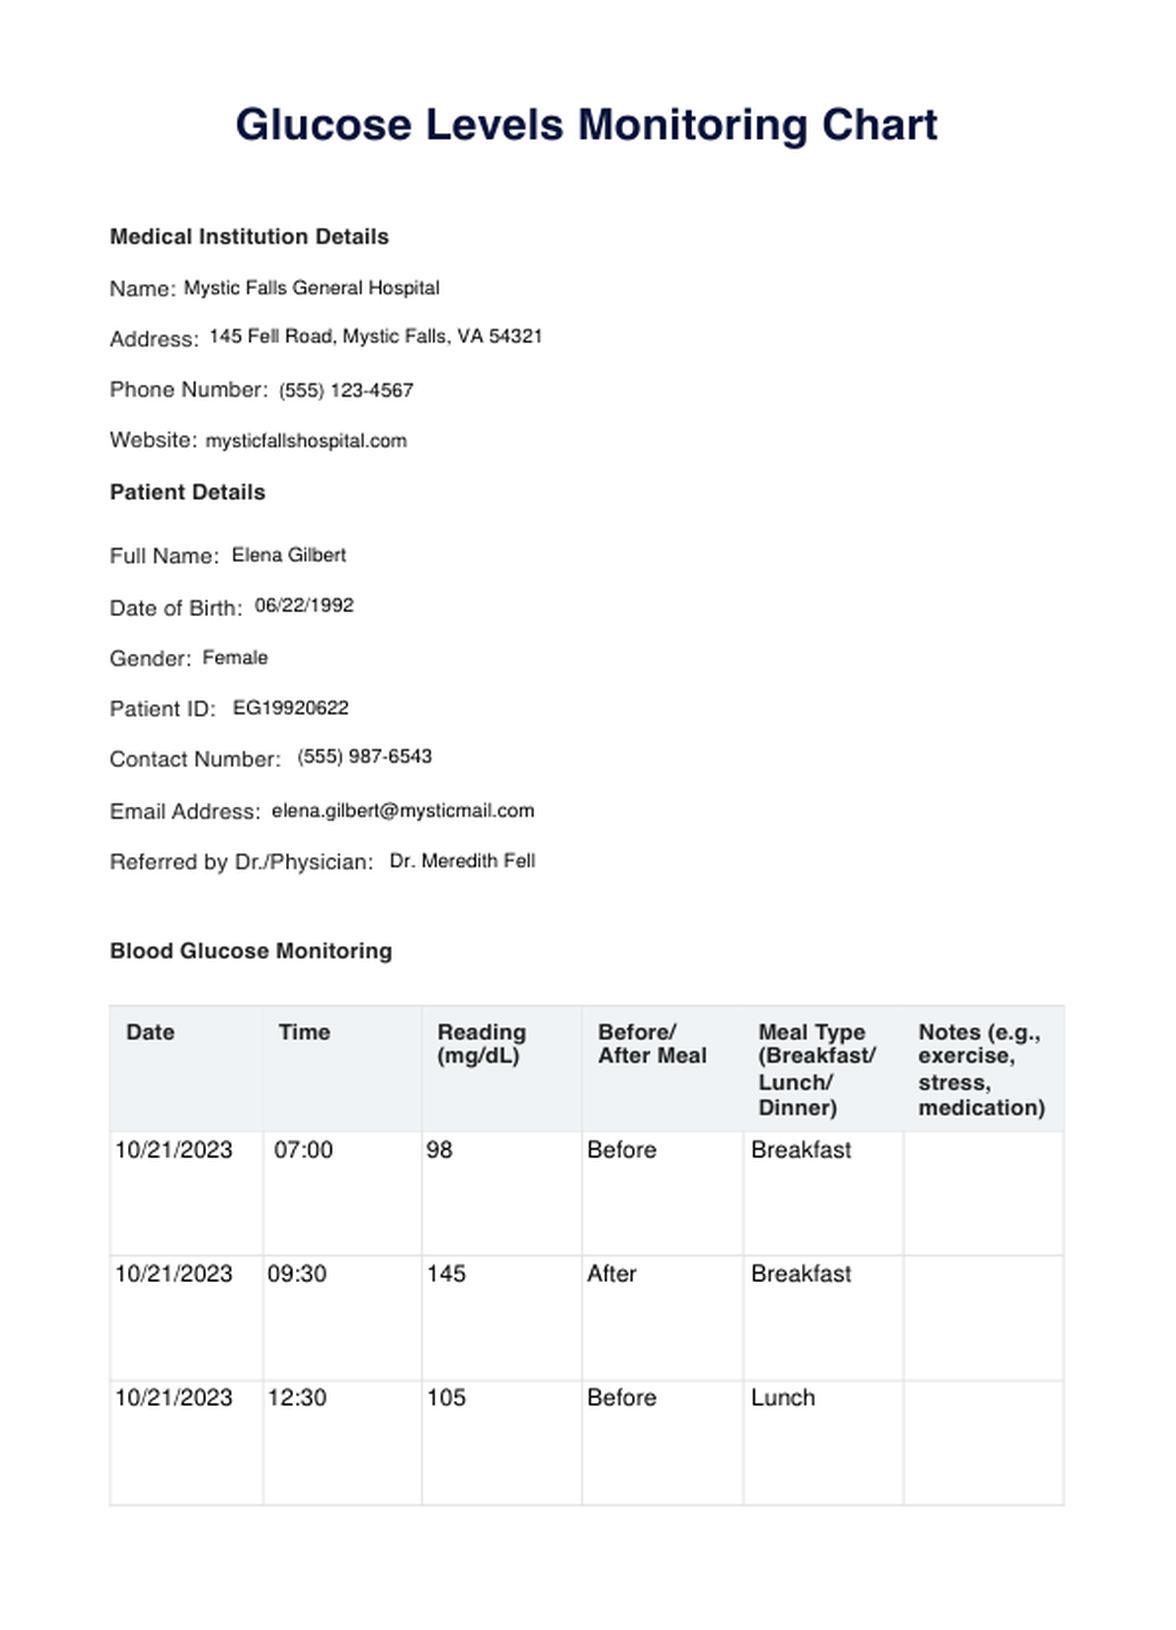
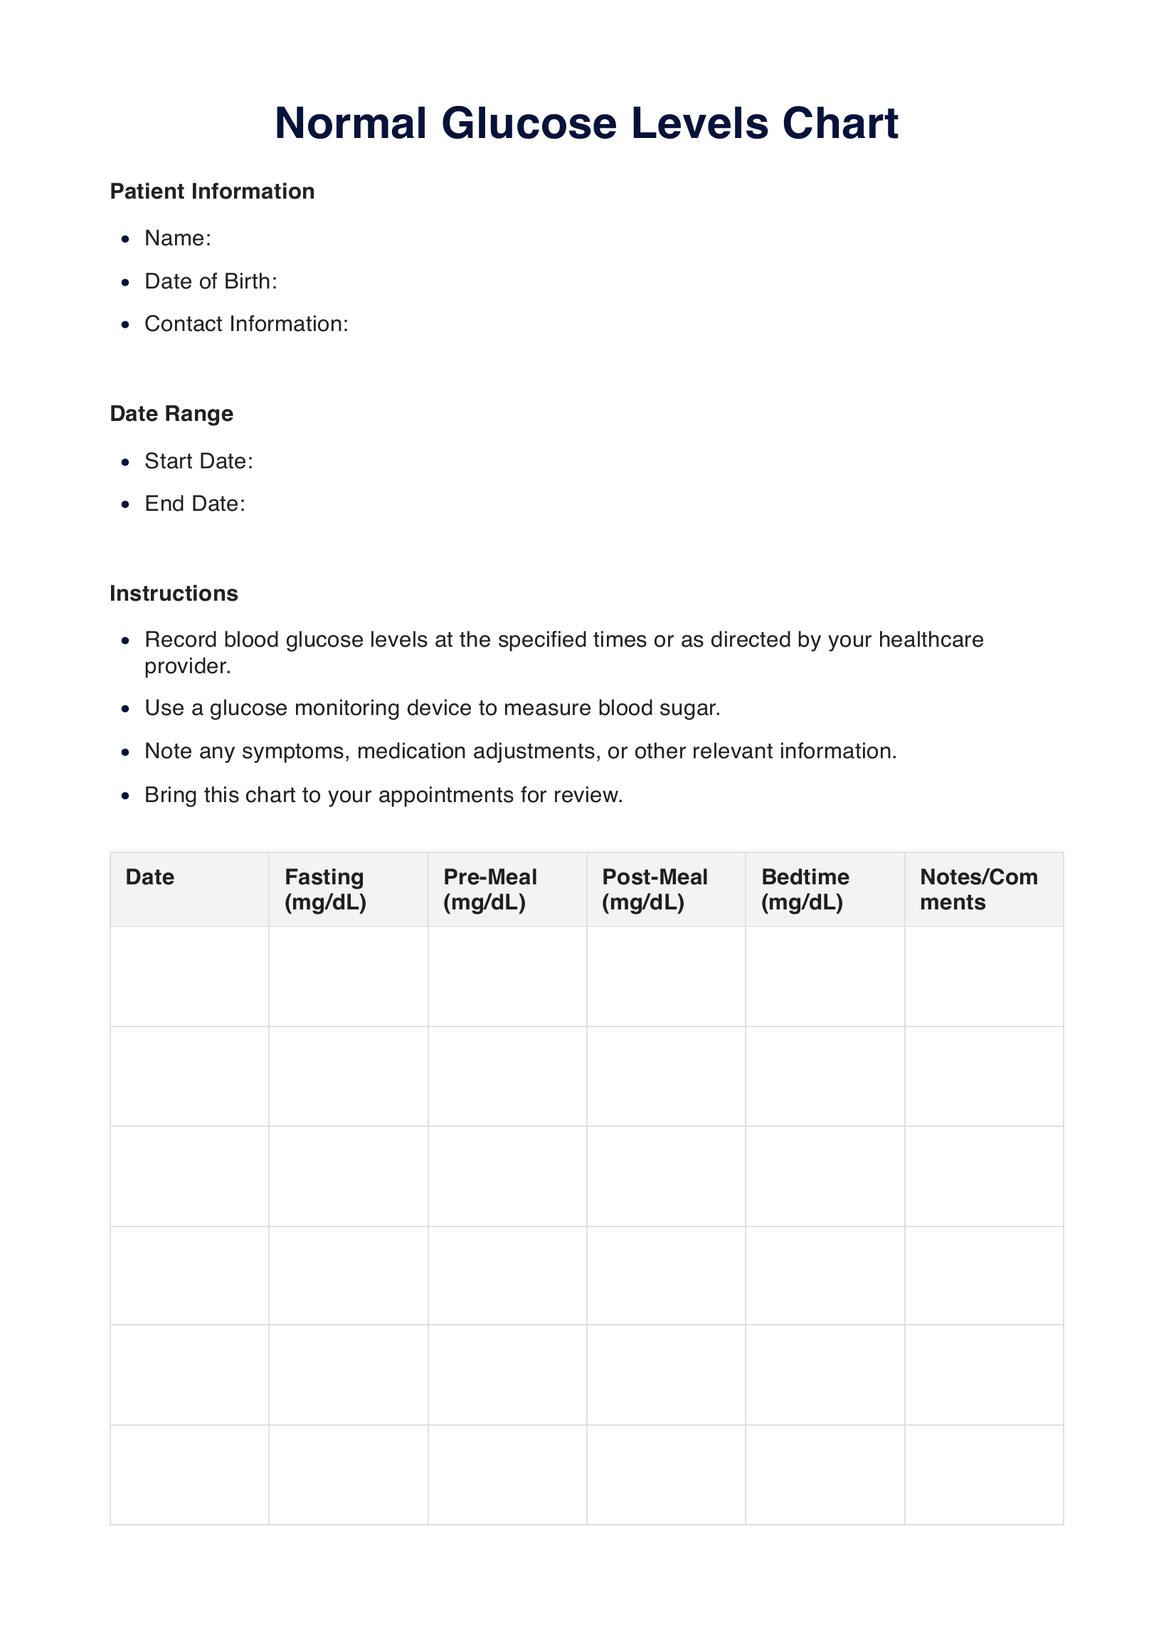
Data Collection: The chart is primarily structured around glucose readings, typically taken at specific intervals, including fasting (before meals), post-prandial (after meals), and bedtime.
Device Integration: Modern charts offer the convenience of syncing with digital glucose monitoring devices. This allows for automatic data import, ensuring accuracy and reducing manual entry errors.
Visualization and Interpretation
Plotting Data: Once the readings are inputted or synced, the chart visually represents these values, showcasing the trend of glucose fluctuations over time.
- Color-Coded Indicators: To enhance user-friendliness, the chart employs color-coded sections. These colors help users quickly discern if their glucose readings are within the optimal range, slightly elevated, or critically high.
- Time-Based Segmentation: The chart often segments readings based on the day, allowing users to see how their glucose levels respond to meals, activities, or sleep.
Analysis and Action
Pattern Recognition: One of the primary benefits of consistently updating the chart is the ability to identify patterns. Recognizing consistent highs after specific meals, for instance, can indicate the need for dietary adjustments.
Treatment Adjustments: By observing trends and patterns, individuals and healthcare professionals can make informed decisions about medication dosages, insulin injections, or lifestyle changes.
Accessibility and Sharing
Digital Access: Many modern platforms, like the [Printable Glucose Levels Chart], offer digital versions that can be accessed on various devices, ensuring users have their data at their fingertips.
Our printable Glucose Levels Chart is a dynamic tool that evolves with the user, providing insights and actionable data to ensure optimal diabetes management.
When would you use this Chart?
The Glucose Levels Chart serves as a pivotal tool in the realm of diabetes management and general health monitoring. Its applications are diverse, catering to both individuals and healthcare professionals. Here are some primary scenarios where the chart proves indispensable:
- Personal Health Tracking: For individuals diagnosed with diabetes or those at risk, daily monitoring of blood sugar levels is crucial. The chart offers a structured way to record and visualize these readings, making it easier to spot trends or anomalies.
- Dietary and Lifestyle Impact Analysis: The foods we consume, our activity levels, and even stress can influence glucose levels. By logging readings after meals or specific activities, the chart helps users understand how different factors impact their blood sugar. This can guide dietary choices, exercise routines, and stress management techniques.
- Medication Efficacy Evaluation: For those on anti-diabetic medications or insulin, the chart can help assess the effectiveness of these treatments. Regular readings can indicate if the current dosages are adequate or if adjustments are needed.
- Educational Tool: For newly diagnosed individuals or those looking to enhance their understanding of diabetes, the chart serves as an educational resource. It visually emphasizes the importance of staying within recommended glucose ranges and the potential risks of prolonged deviations.
- Clinical Decision Support: Healthcare professionals can utilize the chart during patient consultations. It provides a comprehensive view of a patient's glucose management, aiding in diagnostic evaluations and treatment planning.
The Glucose Levels Chart is not just a tool but a companion in the journey towards optimal health, ensuring that blood sugar levels are consistently monitored and managed.

What do the results mean?
Interpreting the results from a Glucose Levels Chart is pivotal for effective diabetes management and overall health. The chart provides a visual representation of blood sugar levels over time, and understanding these readings is the key to proactive health management. Here's a breakdown of what the results typically signify:
Within Target Range
Readings consistently within the recommended range indicate effective glucose management. This suggests that lifestyle choices, dietary habits, and medications (if any) work harmoniously to maintain blood sugar levels.
Elevated Readings
Consistently high glucose readings can be a cause for concern. They might indicate:
- Inadequate medication dosage or efficacy.
- Dietary choices that are not conducive to maintaining stable blood sugar levels.
- Other underlying health issues that might be affecting glucose metabolism.
Low Readings
Persistently low glucose levels can be equally alarming. They might suggest:
- Overmedication or an overly aggressive insulin regimen.
- Skipping meals or not consuming enough carbohydrates.
- Excessive physical activity without adequate dietary compensation.
Fluctuating Readings: If the chart shows significant fluctuations between high and low readings, it might indicate unstable glucose management. Factors such as inconsistent meal timings, varying activity levels, or irregular medication intake can contribute to this.
Consistency is Key: While occasional deviations from the target range might not be alarming, consistent anomalies should be addressed. They can indicate a need for a more structured management plan or a review of current strategies.
In all scenarios, it's paramount to consult with a healthcare professional. They can provide a holistic interpretation of our Free Glucose Levels Chart, considering other health parameters and individualized treatment goals. This collaborative approach ensures that individuals are not just reacting to readings but proactively managing their health.
Research & Evidence
The Glucose Levels Chart, a pivotal tool in diabetes care, traces its origins back to the early days of diabetes research. Over the years, its importance has been underscored by many scientific studies and clinical observations.
Historically, as our understanding of diabetes deepened, the need for a comprehensive tool to monitor and manage blood sugar levels became evident. This led to the development of the Glucose Levels Chart, which provided a visual representation of blood sugar levels, making it easier for patients and healthcare professionals to track and understand glucose fluctuations.
Numerous studies have validated the efficacy of the Glucose Levels Chart. For instance, research published in Healthline emphasized the chart's role in improving patient outcomes by facilitating better glycemic control (Healthline, 2022). Another study from Forbes Health highlighted the chart's significance in patient education, noting that a visual representation of glucose levels enhances patient comprehension and engagement in their care (Forbes Health, 2022).
Furthermore, the chart's visual nature aids healthcare professionals in making informed treatment decisions. By analyzing glucose trends, they can tailor treatment plans, adjust medication dosages, and provide specific dietary and lifestyle recommendations.
The Glucose Levels Chart's enduring relevance in diabetes care is a testament to its utility, effectiveness, and the extensive body of research supporting its use.
References
Forbes Health. (2022). Normal Blood Sugar Levels: What You Need to Know. Retrieved from https://www.forbes.com/health/body/normal-blood-sugar-levels/
Healthline. (2022). Diabetes and Blood Sugar Levels. Retrieved from https://www.healthline.com/health/diabetes/blood-sugar-level-chart
Commonly asked questions
Individuals with diabetes, caregivers, and healthcare professionals typically use the Glucose Levels Chart.
For daily monitoring, during medical appointments, and when making treatment decisions.
Glucose Levels Charts are used to track and analyze blood sugar readings over time.
It varies based on the frequency of readings and the duration of monitoring.
Related Templates

Popular Templates