Calprotectin

Improve your gastrointestinal health with the Calprotectin Chart. Download the PDF for seamless monitoring and better care.

By Joshua Napilay on Jul 15, 2024.

tick

Fact Checked by Ericka Pingol.

Use Template
AI IconToolbarShare ui

What Is a Calprotectin Chart?

Calprotectin is a protein found in the cytoplasm of human neutrophils, a type of white blood cell. It is often used as a biomarker to assess inflammation in the gastrointestinal tract, particularly in conditions such as inflammatory bowel disease (IBD), including Crohn's disease and ulcerative colitis.

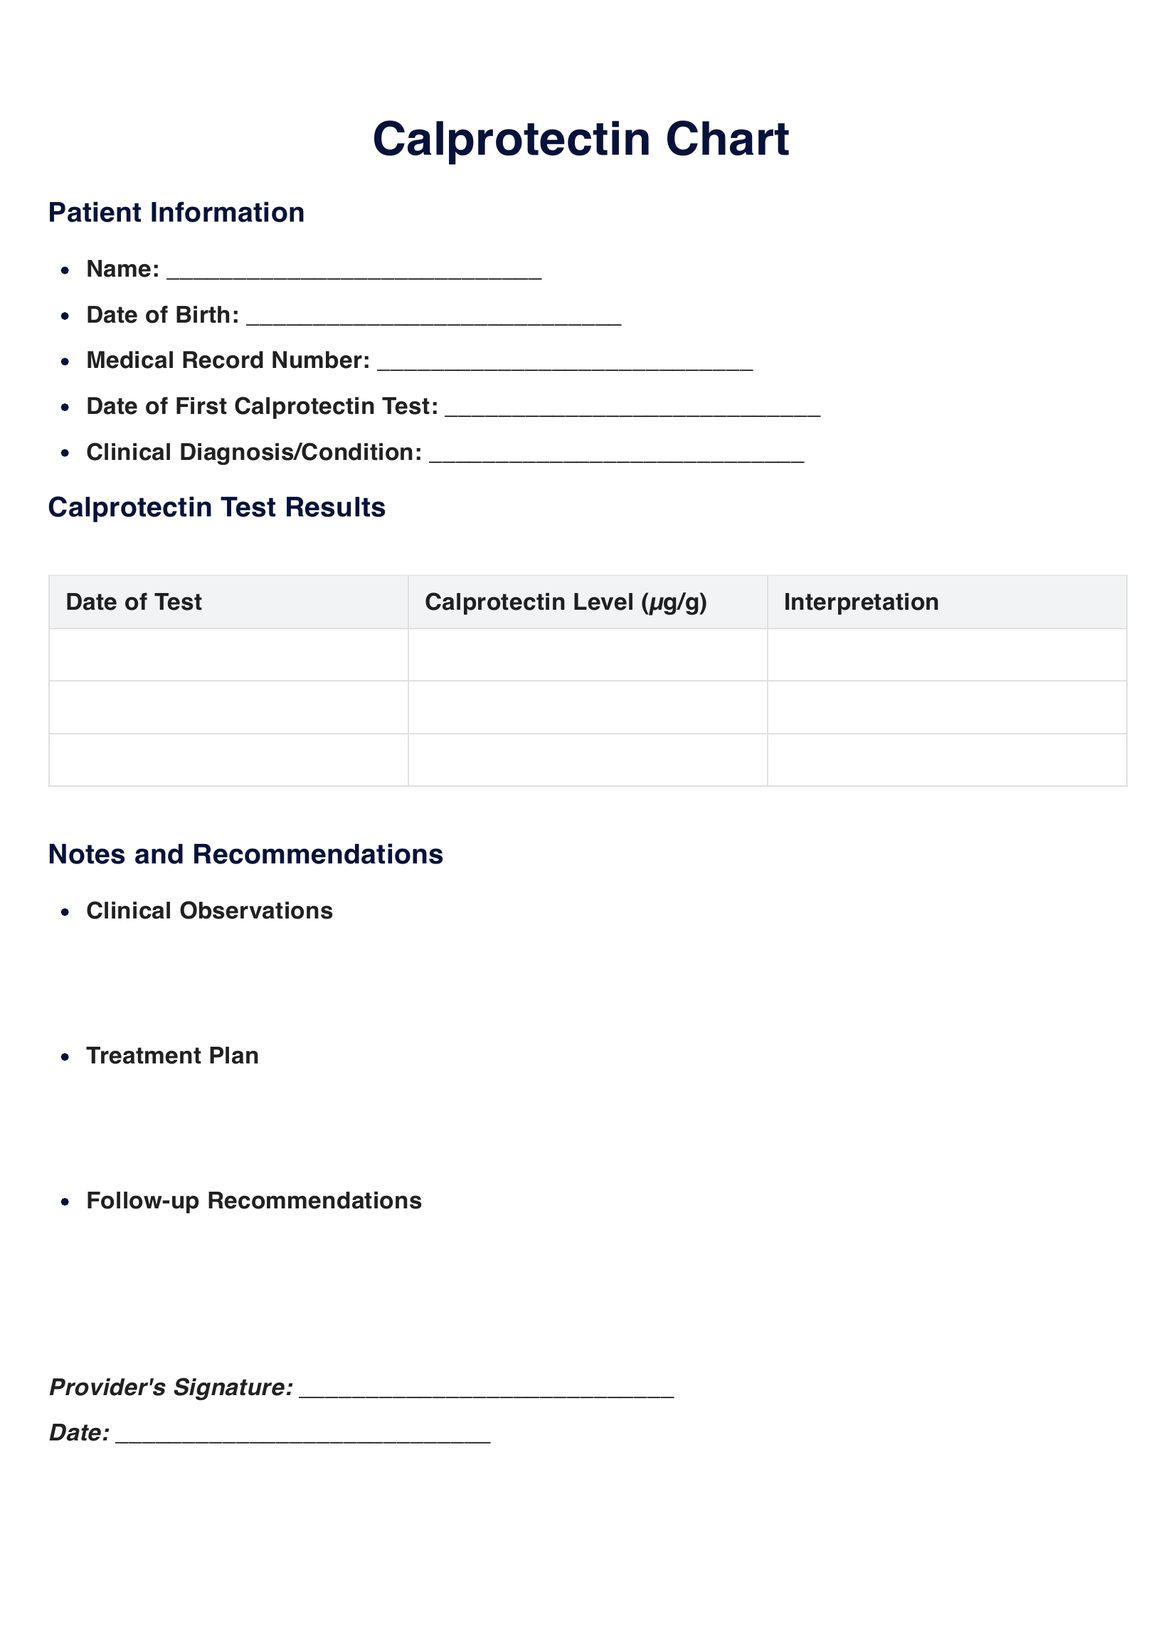
A calprotectin chart or calprotectin test results presented graphically over time serve as a valuable resource in monitoring and managing inflammatory bowel conditions. The chart typically displays calprotectin levels in fecal samples collected from patients during different periods. Fecal calprotectin levels indicate the degree of inflammation in the intestines, with higher levels often correlating with more severe inflammation.

The chart allows healthcare professionals to track changes in calprotectin levels over time, helping them assess the effectiveness of treatments, identify flare-ups, and make informed decisions about adjustments to the patient's management plan. A rising trend in calprotectin levels may suggest increased inflammation, prompting further investigation or a change in treatment strategy.

Patients with chronic gastrointestinal conditions may benefit from regular monitoring through calprotectin charts, enabling early detection of potential issues and timely intervention. This proactive approach can contribute to better disease management and improved quality of life for individuals with Crohn's disease or ulcerative colitis.

It's important to note that the specifics of calprotectin charts and their interpretation may vary based on the healthcare provider, the laboratory analyzing the samples, and evolving medical practices. Individuals should consult their healthcare professionals for the most accurate and up-to-date information.

How Does It Work?

The comprehensive process of utilizing a calprotectin chart involves several detailed steps to effectively monitor and manage inflammatory conditions in the gastrointestinal tract.

Fecal Sample Collection

Patients initiate the process by collecting a stool sample at home, utilizing containers provided by healthcare providers. This non-invasive step allows for convenient sample acquisition.

Laboratory Processing

The collected stool sample is then dispatched to a laboratory for meticulous analysis. Highly trained technicians employ advanced techniques, such as enzyme-linked immunosorbent assay (ELISA), to extract and quantify calprotectin levels from the sample.

Calprotectin Measurement

Calprotectin levels are measured by lab professionals in µg/g of stool. Accurate measurement is crucial for precise insights into gastrointestinal inflammation.

Interpretation of Results

Healthcare professionals interpret the calprotectin results based on established reference ranges. This step is pivotal in understanding the severity of inflammation guiding subsequent decisions regarding patient management.

Tracking Over Time

Results are chronologically plotted on the calprotectin chart, visually representing calprotectin levels over different periods. This longitudinal tracking is essential for identifying trends and patterns in inflammation.

Printable Calprotectin Chart

Patients receive or obtain a printable calprotectin chart, often provided by healthcare providers or reputable medical sources, to facilitate comprehensive monitoring.

Date and Result Entry

Patients meticulously record the dates of calprotectin tests and corresponding results on the chart, ensuring an accurate representation of their inflammatory status over time.

Reference Ranges and Trend Analysis

The chart provides reference ranges for calprotectin levels, aiding in result interpretation. Updated regularly for trend analysis and insights into disease progression.

Consultation

Calprotectin charts are invaluable tools during consultations. They foster informed discussions between patients and healthcare providers, leading to collaborative treatment decisions and a thorough understanding of the patient's gastrointestinal health.

When Would You Use This Chart?

The utilization of a Calprotectin Chart is especially pertinent in the field of gastroenterology. It is invaluable for healthcare practitioners involved in the diagnosis and management of inflammatory bowel diseases (IBD) such as Crohn's disease and ulcerative colitis.

Here are instances when employing a Calprotectin Chart proves to be particularly beneficial:

  • Diagnosis and Initial Assessment: Gastroenterologists often use Calprotectin Charts during the initial diagnostic phase. Elevated calprotectin levels can serve as an indicator of possible gastrointestinal inflammation, prompting further investigation.
  • Monitoring Disease Activity: For rheumatologists and gastroenterologists managing patients with known IBD, regular monitoring using the Calprotectin Chart helps assess disease activity. It quantitatively measures inflammation, aiding in treatment decisions and adjustments.
  • Treatment Efficacy Evaluation: Primary care physicians and gastrointestinal specialists utilize the chart to evaluate the effectiveness of prescribed treatments. A decreasing trend in calprotectin levels may signify a positive response to therapy.
  • Detecting Flare-Ups: Nurse practitioners and physician assistants can use the Calprotectin Chart to see early signs of flare-ups in patients with IBD. This proactive approach enables timely intervention and prevents worsening of symptoms.
  • Post-Surgical Monitoring: Surgeons and gastrointestinal specialists may employ the Calprotectin Chart to monitor post-surgical patients. Persistent or rising calprotectin levels post-surgery may indicate ongoing inflammation or complications.
  • Pediatric Gastroenterology: Pediatric gastroenterologists find the Calprotectin Chart valuable when managing pediatric patients with suspected or diagnosed IBD. It aids in assessing disease severity and treatment response in a non-invasive manner.
  • Shared Decision-Making: Multidisciplinary teams involving gastroenterologists, nurses, and other healthcare professionals can use the chart as a visual aid during patient consultations. This fosters shared decision-making by involving patients in discussions about their disease management.
  • Long-Term Disease Management: Healthcare providers managing patients with chronic gastrointestinal conditions use the Calprotectin Chart for long-term disease management. Regular updates help establish trends, guide treatment plans, and enhance patient care.

What Do the Results Mean?

Interpreting the results of a Calprotectin Chart is crucial for understanding the inflammatory status of the gastrointestinal tract. Calprotectin levels are typically measured in micrograms per gram (µg/g) of stool, and various ranges help healthcare professionals and patients comprehend the implications of the results.

  • Normal Range (0-50 µg/g): Calprotectin levels within the normal range suggest minimal to no inflammation in the gastrointestinal tract. This is typical for individuals without active inflammatory bowel diseases (IBD) or other gastrointestinal conditions.
  • Borderline or Mild Elevation (50-200 µg/g): Borderline or mildly elevated calprotectin levels may indicate a low level of inflammation. This could be seen in conditions such as irritable bowel syndrome (IBS) or mild gastrointestinal infections.
  • Moderate Elevation (200-500 µg/g): Moderately elevated calprotectin levels often suggest a more significant degree of inflammation. This range is commonly associated with inflammatory bowel diseases like Crohn's or ulcerative colitis.
  • High Elevation (>500 µg/g): Calprotectin levels exceeding 500 µg/g indicate a substantial level of inflammation. This result is indicative of a more severe or active flare-up in conditions like IBD, prompting a closer evaluation of the patient's treatment plan.

Understanding these ranges is vital for healthcare providers and patients alike. A consistent increase in calprotectin levels over time may signal a worsening condition, while decreasing levels may suggest a positive response to treatment. It's important to note that individual variations exist, and results should always be interpreted in the context of the patient's overall clinical presentation.

The free Calprotectin Chart, often provided by healthcare professionals or accessible online, assists patients in visualizing and tracking these results. Regularly updating the chart with test dates and corresponding calprotectin levels facilitates a comprehensive understanding of the disease progression and guides healthcare decisions to optimize patient care.

Research & Evidence

Calprotectin's journey as a biomarker for assessing gastrointestinal inflammation has progressed significantly, with a foundation built on extensive research and clinical evidence (Benítez & García–Sánchez, 2015). Acknowledged initially for its antimicrobial properties, calprotectin's concentration in inflamed gastrointestinal tissues sparked exploration into its potential as a marker for intestinal inflammation (Blad, Palmqvist, & Karling, 2022).

Pioneering work in the 1990s firmly established a robust correlation between elevated fecal calprotectin levels and active gut inflammation, particularly in discerning between inflammatory bowel diseases (IBD) and non-inflammatory conditions. Subsequent research consistently upheld calprotectin's role as a reliable, non-invasive marker for monitoring disease activity in conditions like Crohn's disease and ulcerative colitis (Freeman et al., 2021).

Recent meta-analyses further validate the diagnostic accuracy and clinical utility of calprotectin testing in differentiating IBD from non-IBD gastrointestinal disorders. This collective evidence underscores calprotectin's significance in diagnosis, assessing treatment response, and predicting disease relapse (Udeh et al., 2021).

Diverse patient populations consistently highlight the reliability and versatility of calprotectin as a biomarker. Additionally, its expanding clinical significance is evident in its emerging role in conditions such as colorectal cancer (Dijkhuis et al., 2022) and its relevance in COVID-19 (Hovstadius et al., 2021).

References

Benítez, J. M., & García–Sánchez, V. (2015). Fecal calprotectin: Management in inflammatory bowel disease. World Journal of Gastrointestinal Pathophysiology, 6(4), 203. https://doi.org/10.4291/wjgp.v6.i4.203

Blad, N., Palmqvist, R., & Karling, P. (2022). Pre-diagnostic fecal calprotectin levels in patients with colorectal cancer: a retrospective study. BMC Cancer, 22(1). https://doi.org/10.1186/s12885-022-09440-4

Dijkhuis, L. E. J. L., Crouwel, F., Duijvestein, M., Buiter, H. J. C., De Boer, N. K., & Hamer, H. M. (2022). The Reliability of Patient-Performed Fecal Calprotectin Testing in inflammatory bowel disease. The Journal of Applied Laboratory Medicine, 8(2), 319–329. https://doi.org/10.1093/jalm/jfac078

Freeman, K., Ryan, R., Parsons, N. R., Taylor‐Phillips, S., Willis, B. H., & Clarke, A. (2021). Fecal calprotectin testing in UK general practice: a retrospective cohort study using The Health Improvement Network database. British Journal of General Practice, 71(712), e854–e861. https://doi.org/10.3399/bjgp.2021.0125

Hovstadius, H., Lundgren, D., & Karling, P. (2021). Elevated Faecal Calprotectin in Patients with a Normal Colonoscopy: Does It Matter in Clinical Practice? A Retrospective Observational Study. Inflammatory Intestinal Diseases, 6(2), 101–108. https://doi.org/10.1159/000513473

Udeh, R., Advani, S., De Guadiana Romualdo, L. G., & Dolja‐Gore, X. (2021). Calprotectin, an Emerging biomarker of Interest in COVID-19: A Systematic Review and Meta-Analysis. Journal of Clinical Medicine, 10(4), 775. https://doi.org/10.3390/jcm10040775

Who typically requests a Calprotectin Chart?

Commonly asked questions

Who typically requests a Calprotectin Chart?

Healthcare providers, particularly gastroenterologists and primary care physicians, typically request a Calprotectin Chart for patients with suspected or diagnosed inflammatory bowel conditions.
When are Calprotectin Charts used?

Calprotectin Charts monitor gastrointestinal health, assess inflammation levels, and manage conditions like Crohn's disease and ulcerative colitis. They are employed during diagnosis, treatment evaluation, and long-term disease management.

How are Calprotectin Charts used?

Patients collect a stool sample, which is analyzed in a laboratory for calprotectin levels. The results are then plotted on the Calprotectin Chart, allowing healthcare providers and patients to track trends, assess disease activity, and make informed decisions about treatment plans.

How long does a Calprotectin Chart take?

The time it takes to complete a Calprotectin Chart depends on the frequency of tests and the patient's specific monitoring needs. Typically, patients collect a stool sample at home, send it to a lab, and the results are available within a few days. The chart is regularly updated throughout a patient's treatment and monitoring plan.

Join 10,000+ teams using Carepatron to be more productive

One app for all your healthcare work