BMP
Download a free BMP Chart template to simplify patient assessments. Access and use this helpful resource for tracking basic metabolic panel results.

Fact Checked by Ericka Pingol.


What is a basic metabolic panel chart?
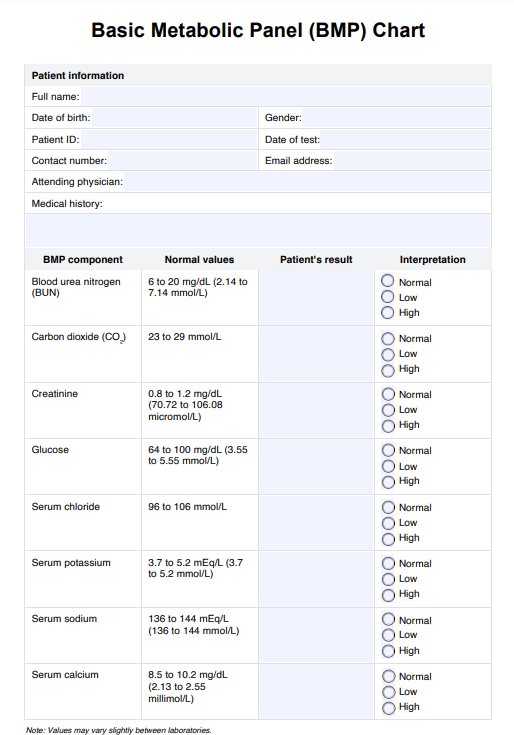
A basic metabolic panel (BMP) Chart is a visual aid for healthcare professionals that collates the key parameters of a BMP blood test. It is a crucial tool for interpreting BMP test results, facilitating easy analysis and intervention.
A basic metabolic panel is a common blood test primarily conducted to assess a patient's metabolism, fluid balance, and kidney health. Typically, a medical practitioner will send a patient's blood sample to a laboratory to perform a BMP analysis. Lab results from a BMP give healthcare providers vital information about the body's chemical balance, electrolyte levels, sugar metabolism, and kidney function.
Unlike a comprehensive metabolic panel, a BMP test is a 'snapshot' of the overall health and function of the metabolic system and kidneys. The blood test measures levels of eight key metabolic markers of kidney function within the bloodstream, including glucose (blood sugar), calcium, sodium, chloride, potassium, carbon dioxide, blood urea nitrogen (BUN), and creatinine.
BMP results are crucial for monitoring chronic medical conditions such as diabetes or kidney disease. An abnormal result may indicate various health issues that require further investigation and medical intervention, such as high blood pressure, kidney failure, or diabetes.
BMP Template
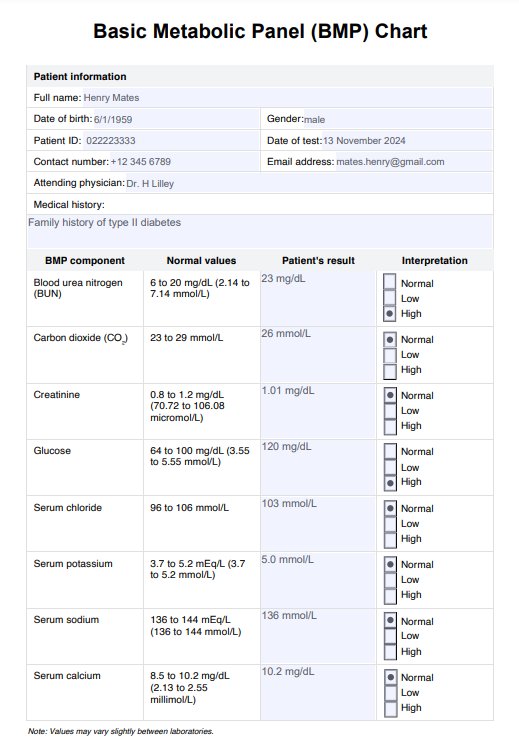
BMP Example
How does it work?
The BMP Chart is a valuable resource for quick reference. Here's how to use it in your clinical practice:
Step 1: Gather your resources
Click the download link on this page to easily download the printable BMP chart. Then, to use it on the Carepatron platform, click the 'Use template' button.
Step 2: Collect the blood sample
A phlebotomist will draw blood for the basic metabolic panel test. To minimize discomfort and ensure accuracy, ensure patients are well-prepared beforehand. Remind them of any required fasting period, and take extra care when preparing younger patients for the blood draw.
Step 3: Record results
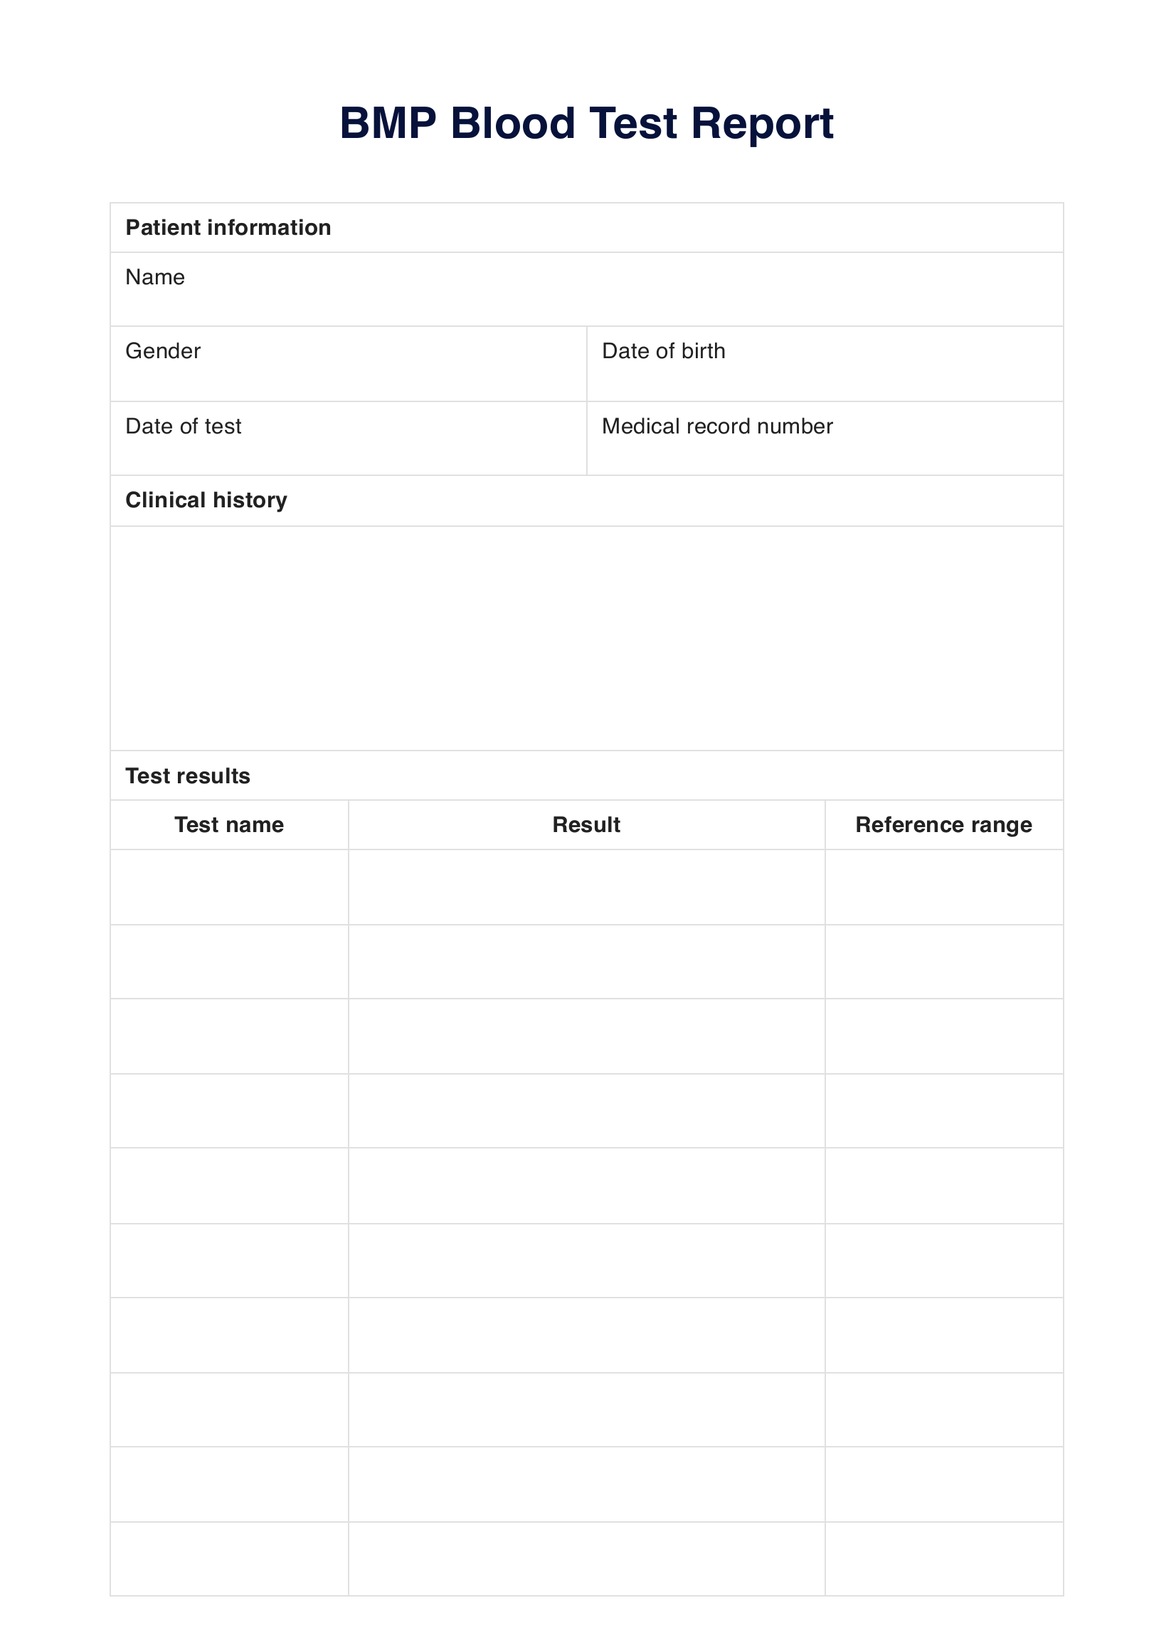
Once the results of the blood tests are available, complete the BMP Chart with all essential patient information, including relevant medical history, any previous abnormal test results, and other vital details. Compare the results to the reference ranges and provide your interpretation. If any abnormal results or concerns arise, consider ordering a comprehensive metabolic panel (CMP) to assess potential liver disease further. The chart also has a remarks section for additional notes and observations.
Step 4: Store the template securely
After reviewing the results and consulting your patient and relevant specialists, you need to secure the BMP Chart so that access is only granted to appropriate parties. Uploading medical records to Carepatron ensures they are secured, stored, and organized.
What do the results mean?
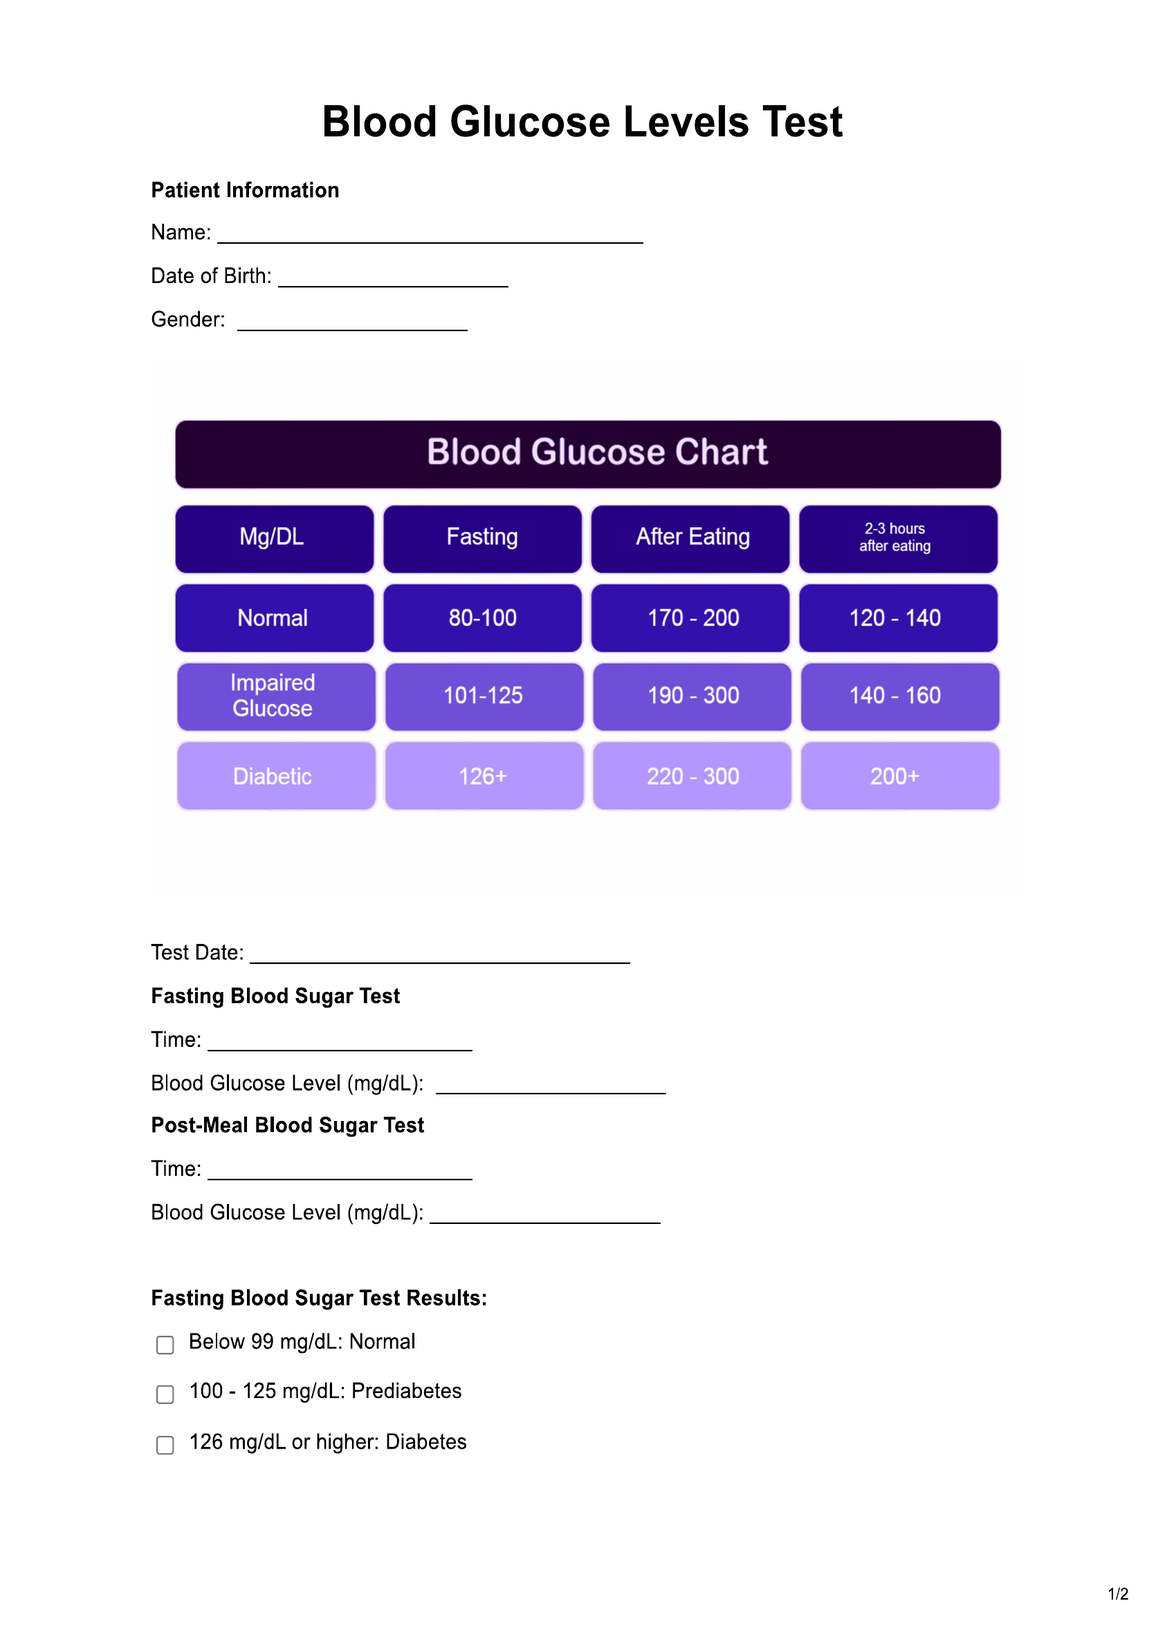
Normal ranges of the following substances indicate healthy metabolic function, while abnormal results may indicate medical complications that warrant further investigation. Note that 'normal' reference ranges may vary depending on the laboratory. Here are what BMP test results mean:
Glucose
A healthy glucose level should sit between 64 to 100 mg/dL (provided the patient fasted for the appropriate period before the blood draw).
A low glucose level may indicate hypoglycemia. If it sits above this range, hyperglycemia may be present. Patients with poorly managed diabetes or blood sugar-spiking medications may present with a high glucose level in the BMP.
Calcium
The parameters for typical calcium levels are 8.5 to 10.2 mg/L.
Low calcium levels, or hypocalcemia, are tied to the functioning of the parathyroid gland and vitamin D intake. Poor vitamin D intake can affect the patient's ability to absorb calcium. A high level of calcium present on the BMP, or hypercalcemia, may be caused by an overactive parathyroid gland. Hypercalcemia indicates a need to monitor the patient's renal status, as there is an increased risk of developing kidney stones.
Sodium
Typical sodium levels are represented by 136 to 144 mEg/L.
Hypernatremia may be a sign of dehydration and poor renal functioning. Hyponatremia, or low sodium, on the other hand, may result from poor kidney function. Note that diuretics like thiazide may affect the kidney's ability to process sodium, and hyponatremia can also be present in patients suffering from diarrhea.
Chloride
The typical normal chloride levels are 96 to 106 mEg/L.
Hypochloremia may be present in patients with renal issues, severe lung disease, or who are on loop diuretics, as this can affect chloride absorption.
Potassium
Potassium levels in the blood should be between 3.7 and 5.2 mEg/L. A patient must stay within this range, as their potassium level can potentially change the functioning and toxicity of certain medications.
Hypokalemia, or low blood potassium levels, indicates the patient may have Cushing's syndrome or is on loop diuretics or corticosteroids. Increased potassium levels indicate renal failure or Addison's disease.
Carbon dioxide (CO2)
Typical blood carbon dioxide levels range between 23 and 29 mmol/L. This key level contributes to the body's acid-base balance and is a byproduct of metabolism, presenting as bicarbonate.
Low levels of CO2 indicate acidic blood and potential acidic diabetic ketoacidosis or drug-related toxicity, such as aspirin toxicity. An increased CO2 level may be present in patients with respiratory issues, such as chronic obstructive pulmonary disease.
Blood urea nitrogen (BUN)
A typical range of BUN, the amount of nitrogen in the bloodstream indicating renal function, is between 6 and 20 mg/dL. A high BUN indicates kidney issues, and a cross-analysis with creatinine levels is essential.
Creatinine
Creatinine levels should typically be between 0.8 and 1.2 mg/dL, and this small range is due to the fact that creatinine should only exist in very small amounts in the bloodstream. High levels of creatinine indicate poor kidney function.
Commonly asked questions
A healthcare professional typically requests that this BMP blood test be carried out by a phlebotomist and receives the results from medical laboratory scientists.
This chart is utilized when a patient is experiencing symptoms that could be related to kidney and/or metabolism issues. Patients with chronic conditions or previous abnormal results seeking an update on treatment success may also use this chart to cross-reference past parameters.
The results are collated within the easy-to-use charting tool and compared against the parameters to help inform the next steps and future interventions. The same chart may be used to collate multiple tests over time to see a change in levels resulting from treatment.
A comprehensive metabolic panel (CMP) is a panel test that includes an extra six tests in addition to the eight included in a basic metabolic panel. These additional tests are albumin, ALT, ALP, AST, total protein, and bilirubin.
Related Templates

Popular Templates