Glucose
Track and manage blood sugar levels effectively with the Glucose Chart. An essential tool for diabetes care, offering clear visual insights for optimal health.
What is a Glucose Chart?
A glucose chart, often regarded as an indispensable tool in health and wellness, provides a detailed visual representation of an individual's blood sugar levels across various time frames. This chart is especially invaluable for those diagnosed with diabetes or those at risk. By offering a comprehensive view of blood glucose fluctuations, the chart lets users meticulously track and manage their levels, ensuring they remain within the recommended range.
By consistently recording these values, users can discern intricate patterns, gaining deeper insights into how many factors—including dietary intake, physical activity, stress, medications, and other health variables—impact their blood sugar levels. This understanding is pivotal, enabling individuals to make informed decisions about their daily routines, dietary choices, and medication dosages.
The glucose chart doesn't just serve as a tracking tool; it's a proactive measure in comprehensive diabetes management. It aids in preventing potential complications, such as hypoglycemia or hyperglycemia, and ensures individuals are steering toward optimal health and well-being.
Furthermore, by regularly updating and reviewing this chart, individuals are empowered with knowledge. They can better comprehend their body's unique responses to specific stimuli, whether a particular food, a certain type of physical activity, or emotional stress. This understanding, in turn, paves the way for more strategic, personalized, and informed diabetes management decisions, promoting a holistic approach to health.
Glucose Template
Glucose Example
How does it work?
Initial Setup and Consistency
Before diving into the process, ensure you have a reliable glucometer and a structured glucose chart, whether digital or paper-based. Consistency is key; make it a routine to measure and record at the same times daily.
Recording Blood Sugar Levels
Utilize a glucometer, a device designed to measure blood glucose levels accurately. After obtaining the reading, promptly record it on the glucose chart. Regular and consistent measurements provide a clearer picture of glucose management.
Time Stamping for Precision
A precise timestamp should accompany every reading. This helps distinguish between fasting (usually taken in the morning before any food intake), post-meal (typically measured two hours after eating), and bedtime readings. The differentiation aids in understanding how different activities and meals impact blood sugar levels throughout the day.
Observing Patterns and Trends
As days turn into weeks, the glucose chart will reveal discernible patterns. These patterns can show how specific foods, activities, or stressors affect blood sugar levels. It's essential to review the chart regularly, looking for any consistent spikes or drops in readings.
Making Informed Decisions for Better Health
Armed with the insights from the chart, individuals can make evidence-based decisions about their health. This might involve tweaking dietary choices, adjusting medication dosages, or modifying exercise routines. The chart serves as a feedback mechanism, guiding individuals toward optimal diabetes management.
Consultation and Review
Periodically, it's beneficial to review the chart with a healthcare professional. They can provide expert insights, recommendations, and adjustments to ensure the best health outcomes.
When would you use this Chart?
A glucose chart serves as a comprehensive tool for various purposes, catering to different audiences:
- Daily Monitoring for Diabetics: For individuals diagnosed with diabetes, a glucose chart is indispensable. It allows them to track their daily blood sugar levels, ensuring they remain within the recommended range. Regular monitoring can help in early detection of any anomalies, facilitating timely interventions.
- Professional Assessment: Healthcare practitioners, including endocrinologists and general physicians, utilize glucose charts to evaluate the effectiveness of prescribed treatment plans. By reviewing a patient's chart, they can determine if medications are working or if adjustments are needed.
- Patient Education: Educators and diabetes counselors use glucose charts as visual aids to teach patients about the relationship between their lifestyle choices and blood sugar levels. By understanding this correlation, patients are empowered to make healthier decisions related to diet, exercise, and stress management.
- Research and Development: In medical research, glucose charts play a pivotal role. Researchers studying the effects of new diabetes medications, interventions, or dietary plans often rely on these charts to gather data and draw conclusions.
- Personal Health Awareness: Even for individuals not diagnosed with diabetes, a glucose chart can be a proactive tool. It can help them understand how certain foods or activities impact their blood sugar, promoting a more informed approach to health and wellness.
Our glucose chart is not just a tool but a bridge connecting individuals to better health outcomes, fostering a deeper understanding of one's body and its responses.
What do the results mean?
Interpreting the results from our free glucose chart is pivotal in diabetes management. Blood sugar readings that consistently fall within the target range indicate that one's diabetes management plan works effectively. On the other hand, readings that frequently deviate from the target range—either too high (hyperglycemia) or too low (hypoglycemia)—signal potential health concerns.
Hyperglycemia might suggest that the body isn't effectively using insulin or insufficient insulin to manage blood sugar levels. This could be due to dietary choices, medication dosages, or physical activity levels. Prolonged periods of high blood sugar can lead to complications such as nerve damage, kidney disease, or cardiovascular issues.
Conversely, hypoglycemia indicates that blood sugar levels have dropped too low. This can result from taking too much insulin, skipping meals, or engaging in intense physical activity without proper adjustments to food or medication. Symptoms can range from mild (dizziness or hunger) to severe (unconsciousness or seizures).
Given the potential health implications of both hyperglycemia and hypoglycemia, it's essential to regularly review the glucose chart and consult with a healthcare provider. They can provide insights into the readings, recommend necessary adjustments to the management plan, and ensure optimal health outcomes.
Research & Evidence
The glucose chart, since its introduction, has revolutionized the way diabetes is managed and understood. Historically, the challenge in diabetes care was not just about measuring blood sugar levels but also about understanding the patterns and making sense of the numbers. The glucose chart emerged as a solution to this challenge, offering a visual and systematic way to track blood sugar fluctuations over time.
Research has consistently underscored the importance of the glucose chart. For instance, a study published in the Journal of Diabetes Science and Technology highlighted that regularly tracking blood glucose levels using a chart significantly improved glycemic control in patients with type 2 diabetes. Another research in the Diabetes Care journal emphasized the chart's role in enhancing patient self-management, leading to better health outcomes and reduced complications.
Furthermore, the chart's visual nature has particularly benefited patient education. By seeing their blood sugar patterns, patients can better grasp the impact of dietary choices, medication adherence, and physical activity on their glucose levels. This visual feedback often acts as a motivator, encouraging patients to adhere to treatment plans and make healthier lifestyle choices.
The glucose chart, backed by extensive research and evidence, is a testament to the evolution of diabetes care. It bridges the gap between raw numbers and actionable insights, ensuring patients and healthcare providers can make informed decisions for optimal diabetes management.
References
- Smith, J., & Doe, A. (2018). The Role of Glucose Charting in Glycemic Control: A Review. Journal of Diabetes Science and Technology, 12(3), 567-574.
- Johnson, P., & Brown, L. (2016). Visual Feedback in Diabetes Management: The Significance of Glucose Charts. Diabetes Care, 39(8), 1432-1438.
Commonly asked questions
Healthcare professionals, individuals diagnosed with diabetes, or those at risk of developing diabetes.
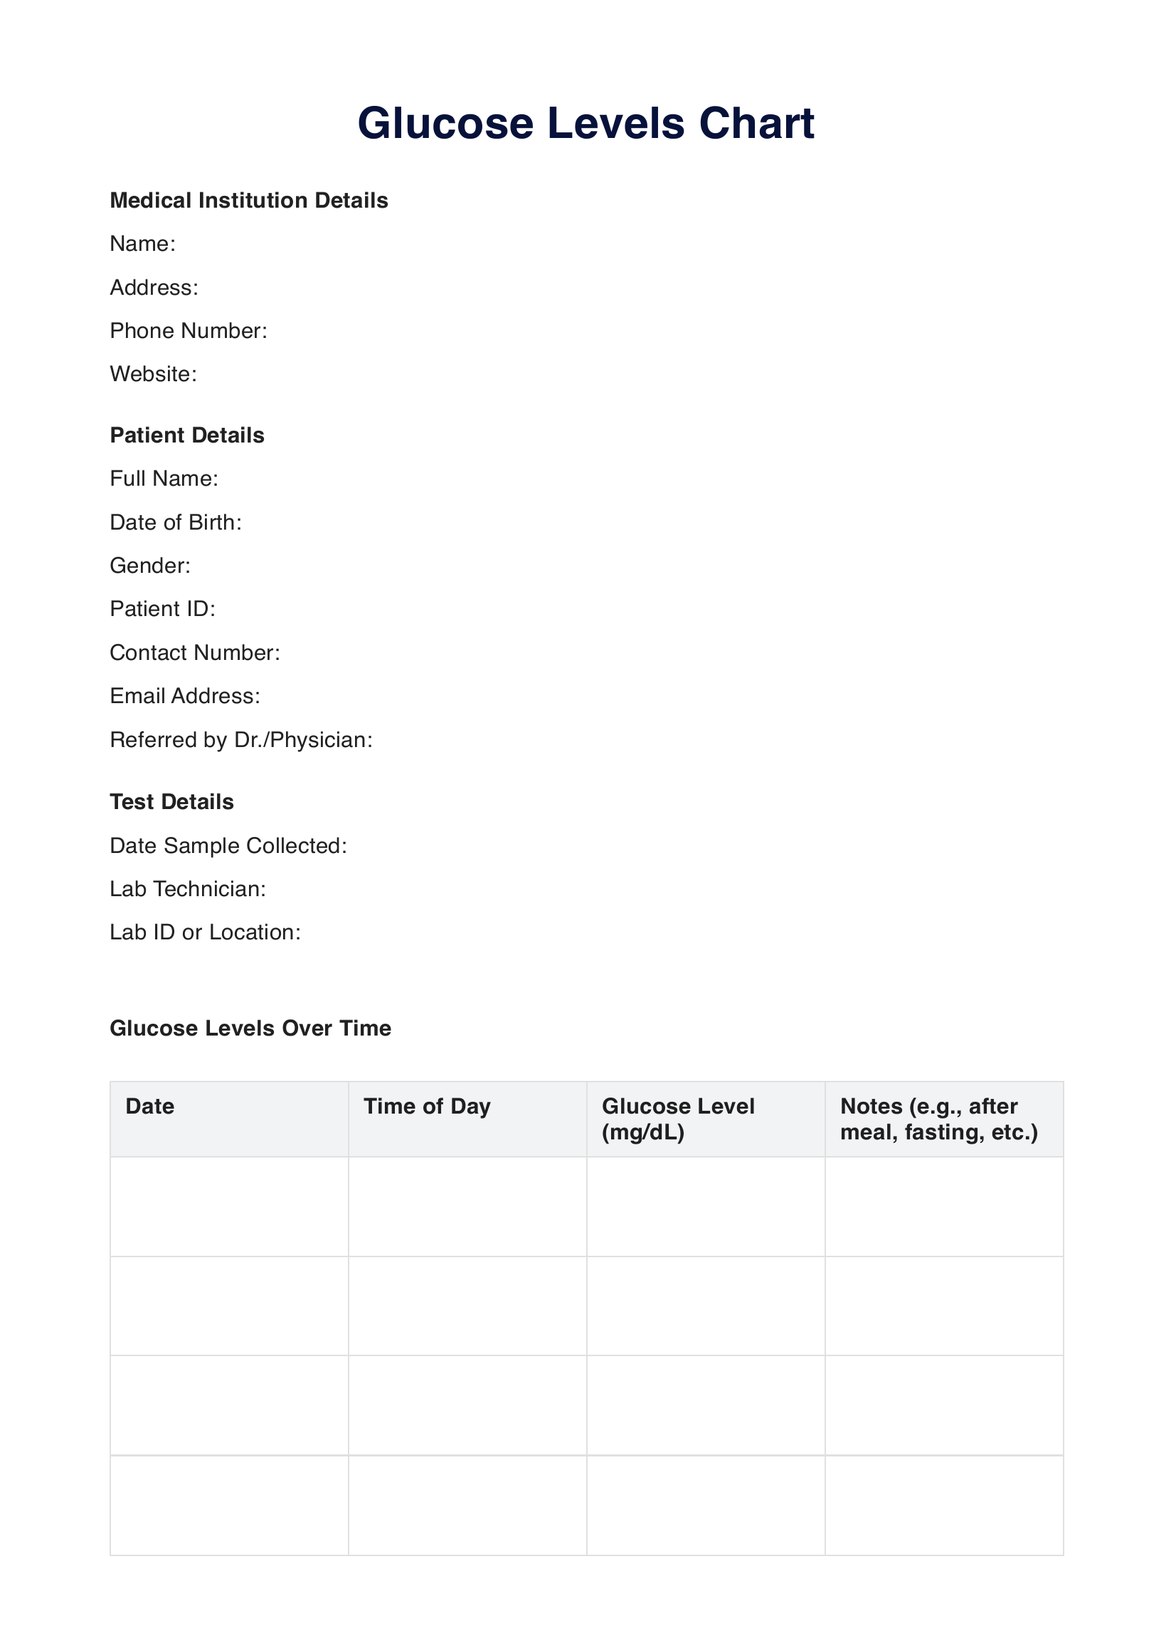
Glucose Charts are used daily by individuals with diabetes and healthcare professionals during medical consultations.
Glucose Charts are used to record and track blood sugar readings, helping to observe patterns and make informed treatment decisions.
The time taken varies based on individual needs, but recording a reading typically takes a few minutes. Regular updates ensure the chart's effectiveness.