ECG Abnormalities Chart
Enhance your diagnostic skills with ECG Abnormalities Charts. Quickly identify heart issues and improve patient care. Download yours now!

Fact Checked by Ericka Pingol.


What is an ECG Abnormalities Chart?
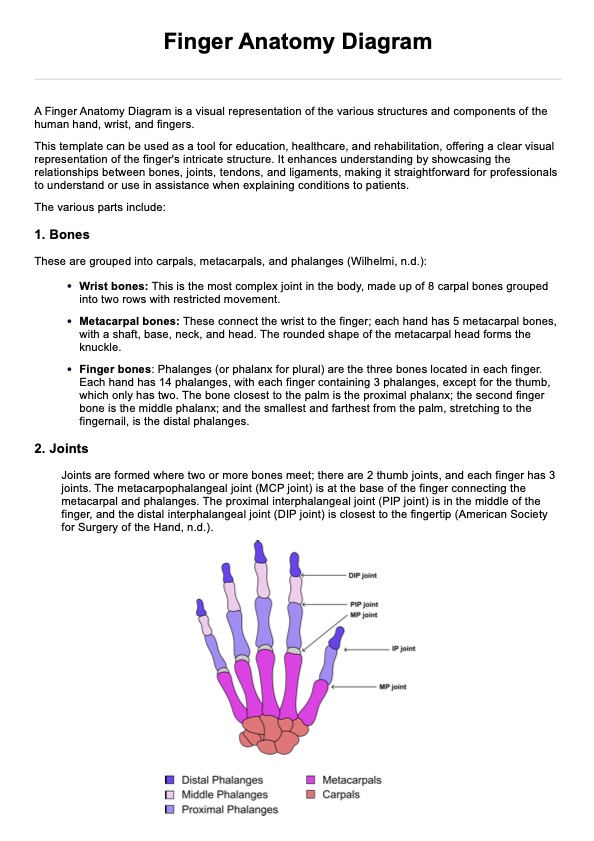
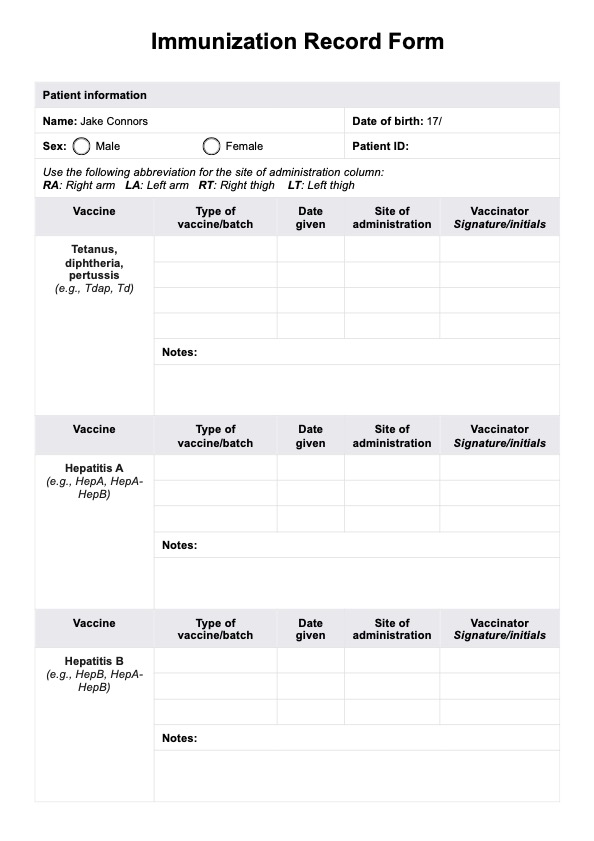
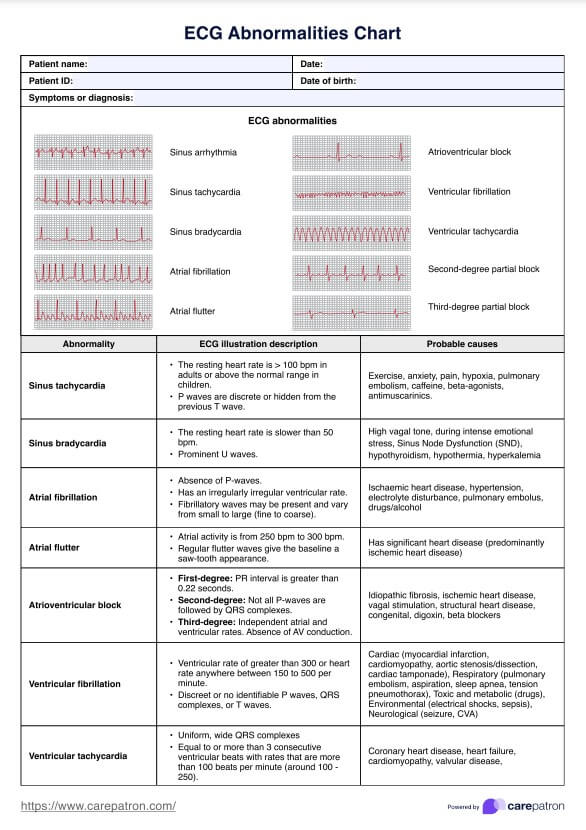
An ECG Abnormalities Chart is a valuable resource that healthcare professionals use to quickly and accurately identify deviations from the heart’s normal electrical activity. The chart helps distinguish between normal rhythm and various abnormal heart rhythms. The chart serves as a visual guide, providing detailed information on common electro diagram (ECG) abnormalities, their associated waveforms, and possible underlying causes. This chart is particularly useful for clinicians who need to interpret ECGs regularly, as it enables them to recognize and differentiate between normal and abnormal heart rhythms more efficiently.
It typically includes illustrations of abnormal waveforms, along with descriptions of each abnormality, such as atrial fibrillation, atrial flutter, ventricular tachycardia, sinus bradycardia, sinus tachycardia, bundle branch blocks, 1st to 3rd-degree AV block, and ST-segment elevation, T wave inversion, or depression. Additionally, the chart may cover specific abnormal findings related to electrolyte imbalances, drug effects, or structural heart diseases.
ECG Abnormalities Chart Template
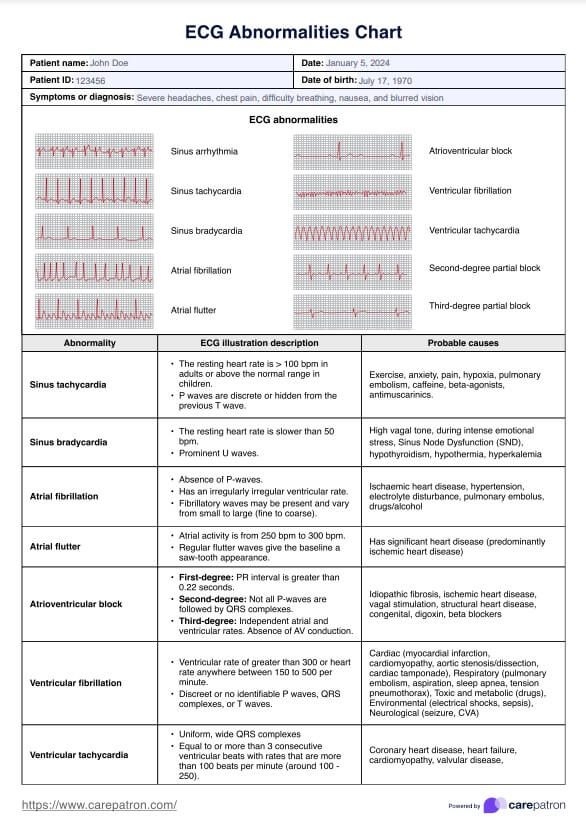
ECG Abnormalities Chart Example
How does the ECG Abnormalities Chart template work?
Here's how to use our template:
Step 1: Obtain the Printable ECG Abnormalities Chart template
To get started, you'll need to acquire a printable ECG Abnormalities Chart template by clicking the links or the buttons - "Use Template" or "Download PDF" - within this guide.
Step 2: Familiarize yourself with the chart
Before using the common ECG Abnormalities Chart, take some time to familiarize yourself with its content and layout. This will enable you to quickly reference the information when analyzing an ECG. Pay attention to the different QRS complexes and waveforms - from P waves to Q waves and even T waves - including those indicating sinus rhythm, their descriptions, and potential underlying causes from the provided abnormal ECG examples.
Step 3: Compare the ECG findings to the chart
Upon obtaining an ECG recording, meticulously analyze the waveforms and contrast them with the illustrations and descriptions in the ECG Abnormalities Chart Template. Identify any discrepancies from normal electrical activity, including irregular heart rhythms, changes in the QRS complex, and the presence or absence of the P wave, Q wave, T wave, and even R wave.
Step 4: Identify specific abnormalities with abnormal ECG examples
Using the chart as a guide, determine if any specific abnormalities are present in the ECG. These may include electrolyte imbalances, drug effects, or structural heart diseases. Make note of your findings for further evaluation and discussion with other healthcare professionals.
Step 5: Document your observations
After identifying any ECG abnormalities, document your observations in the patient's electronic health record or medical chart. Be sure to include the specific abnormality, its potential cause, and any recommended actions or follow-up tests.
You can elevate your practice and client outcomes with the help of this medical chart template.
Step 6: Communicate your findings
Share your findings with the patient and other members of the healthcare team. Discuss the potential implications of the identified abnormalities and collaborate on developing an appropriate treatment plan.
When would you use this ECG Abnormalities Chart?
The ECG Abnormalities Chart template is a valuable resource for healthcare professionals involved in diagnosing and managing heart-related conditions. This template can be utilized in a variety of settings and situations to improve the accuracy and efficiency of electrocardiogram interpretation. Here are some instances when using this template would be appropriate:
- Medical education: The ECG Abnormalities Chart template serves as an excellent teaching tool for medical students, nursing students, and other healthcare trainees learning to interpret ECGs. The visual representations and descriptions of various abnormalities facilitate better understanding and retention of information.
- Primary care: Primary care providers, such as general practitioners and family medicine physicians, may encounter patients with suspected cardiac issues, such as coronary artery disease, during routine consultations. Having this template readily available enables them to quickly identify potential problems and initiate appropriate management or referral.
- Emergency departments: In emergency settings, prompt and accurate ECG interpretation is crucial for timely diagnosis and treatment of life-threatening conditions like acute heart rhythms, arrhythmias, or ventricular fibrillation. The template can assist emergency medicine clinicians in rapidly recognizing abnormal findings and implementing necessary interventions like applying carotid sinus pressure .
- Cardiology clinics: Cardiologists and other specialized healthcare professionals working in cardiology clinics can use the ECG Abnormalities Chart Template as a reference during patient evaluations, ensuring a thorough and accurate assessment of ECG findings.
- Hospital wards: Nurses and other healthcare staff responsible for monitoring hospitalized patients’ ECGs can use the template to detect any concerning changes in real-time, allowing for prompt escalation of care if needed.
- Remote or telemedicine consultations: The template can be particularly useful for healthcare professionals who provide remote consultations or telemedicine services. By having this resource at their fingertips, they can efficiently assess ECG findings and offer appropriate guidance or recommendations.
Benefits of using an ECG Abnormalities Chart
These are the advantages of using this chart for healthcare professionals:
Enhanced accuracy in ECG interpretation
Free ECG Abnormalities Chart provide visual aids and clear descriptions of various abnormalities, helping healthcare professionals accurately identify and diagnose heart-related issues based on electrocardiogram findings.
Time-efficient diagnosis
With a comprehensive ECG Abnormalities Chart at hand, clinicians can quickly compare patient ECGs to the provided examples, streamlining the diagnostic process and enabling prompt initiation of appropriate treatment or management.
Improved medical education
ECG Abnormalities Chart serve as excellent educational resources for medical students, nursing students, and other healthcare trainees, facilitating better understanding and retention of information related to ECG interpretation.
Accessible and user-friendly
Free ECG Abnormalities Chart is often available in easily downloadable formats, like PDFs, making them broadly accessible and convenient for use across various devices. The charts are designed to be user-friendly, with clear illustrations and concise descriptions.
Cost-effective learning and reference tool
As this chart are available for free, healthcare professionals and students can benefit from a valuable learning and reference tool without incurring any additional costs.
Versatility across healthcare settings
Free ECG Abnormalities Chart can be used by various healthcare professionals, including primary care providers, emergency medicine clinicians, cardiologists, nurses, and telemedicine practitioners, making them a versatile resource across multiple clinical settings.
Commonly asked questions
ECG Abnormalities Chart are used by a wide range of healthcare professionals, including cardiologist, primary care physicians, emergency medicine clinicians, nurses and nurse practitioners, medical students and residents, and healthcare providers involved in telemedicine or remote consultations. These charts are beneficial for anyone who needs to interpret electrocardiograms (ECGs) as part of their clinical practice or education.
ECG Abnormalities Chart are versatile, useful in medical education for teaching ECG interpretation, primary care and emergency departments for diagnosing cardiac issues, cardiology clinics for specialized heart assessments, hospital wards for patient ECG monitoring, and during remote consultations for efficient ECG evaluation and guidance.
ECG Abnormalities Chart provide several benefits: they enhance diagnostic accuracy with visual aids, save time in diagnosis by enabling quick comparison to patient ECGs, improve medical education as a valuable learning resource, are accessible and user-friendly due to their clear design and downloadable formats, and offer versatility across different healthcare settings for various professionals.
Related Templates

Popular Templates