Cholesterol Level Chart by Age
Get Carepaton's free Cholesterol Level Chart by Age to support patient monitoring with age-based guidelines for effective clinical use.

Fact Checked by Karina Jimenea.


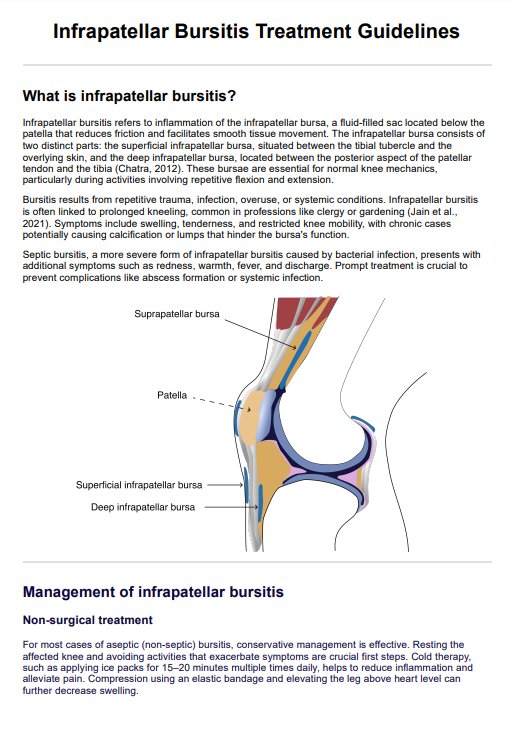
The importance of monitoring cholesterol levels by age
Monitoring cholesterol levels by age is essential for assessing cardiovascular risk and guiding clinical decisions. As patients age, physiological changes and the accumulation of other risk factors can significantly affect cholesterol levels. Tracking total cholesterol, low-density lipoprotein (LDL), high-density lipoprotein (HDL), and triglycerides at age-appropriate intervals enables early identification of high blood cholesterols, which can lead to the buildup of plaque in blood vessels and increase the risk of heart disease and stroke.
Elevated LDL cholesterol is a primary concern due to its role in arterial plaque formation while maintaining adequate HDL cholesterol levels is critical for promoting reverse cholesterol transport (Centers for Disease Control and Prevention, 2024). Regular testing helps determine whether lifestyle changes or pharmacologic interventions, such as statins or cholesterol absorption inhibitors, are necessary.
Routine screening also supports ongoing risk stratification, particularly in patients with hypertension, diabetes, or a family history of cardiovascular disease. Ultimately, age-specific cholesterol monitoring is key to preventive cardiovascular care.
Cholesterol level chart by age Template
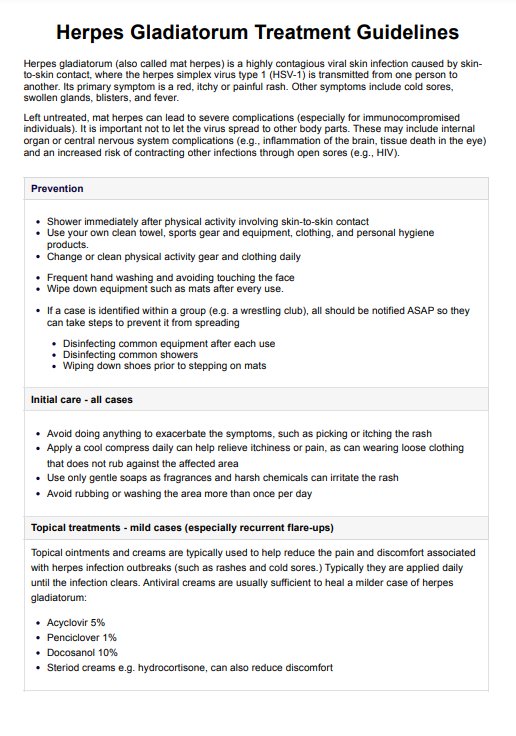
Cholesterol level chart by age Example

What is a Cholesterol Level Chart by Age?
A Cholesterol Level Chart by Age is a reference tool that outlines expected ranges for total cholesterol, LDL cholesterol, HDL cholesterol, and triglyceride levels based on a patient’s age and sex. It supports the interpretation of lipid panel results following a cholesterol test, a routine blood test used to evaluate blood cholesterol levels.
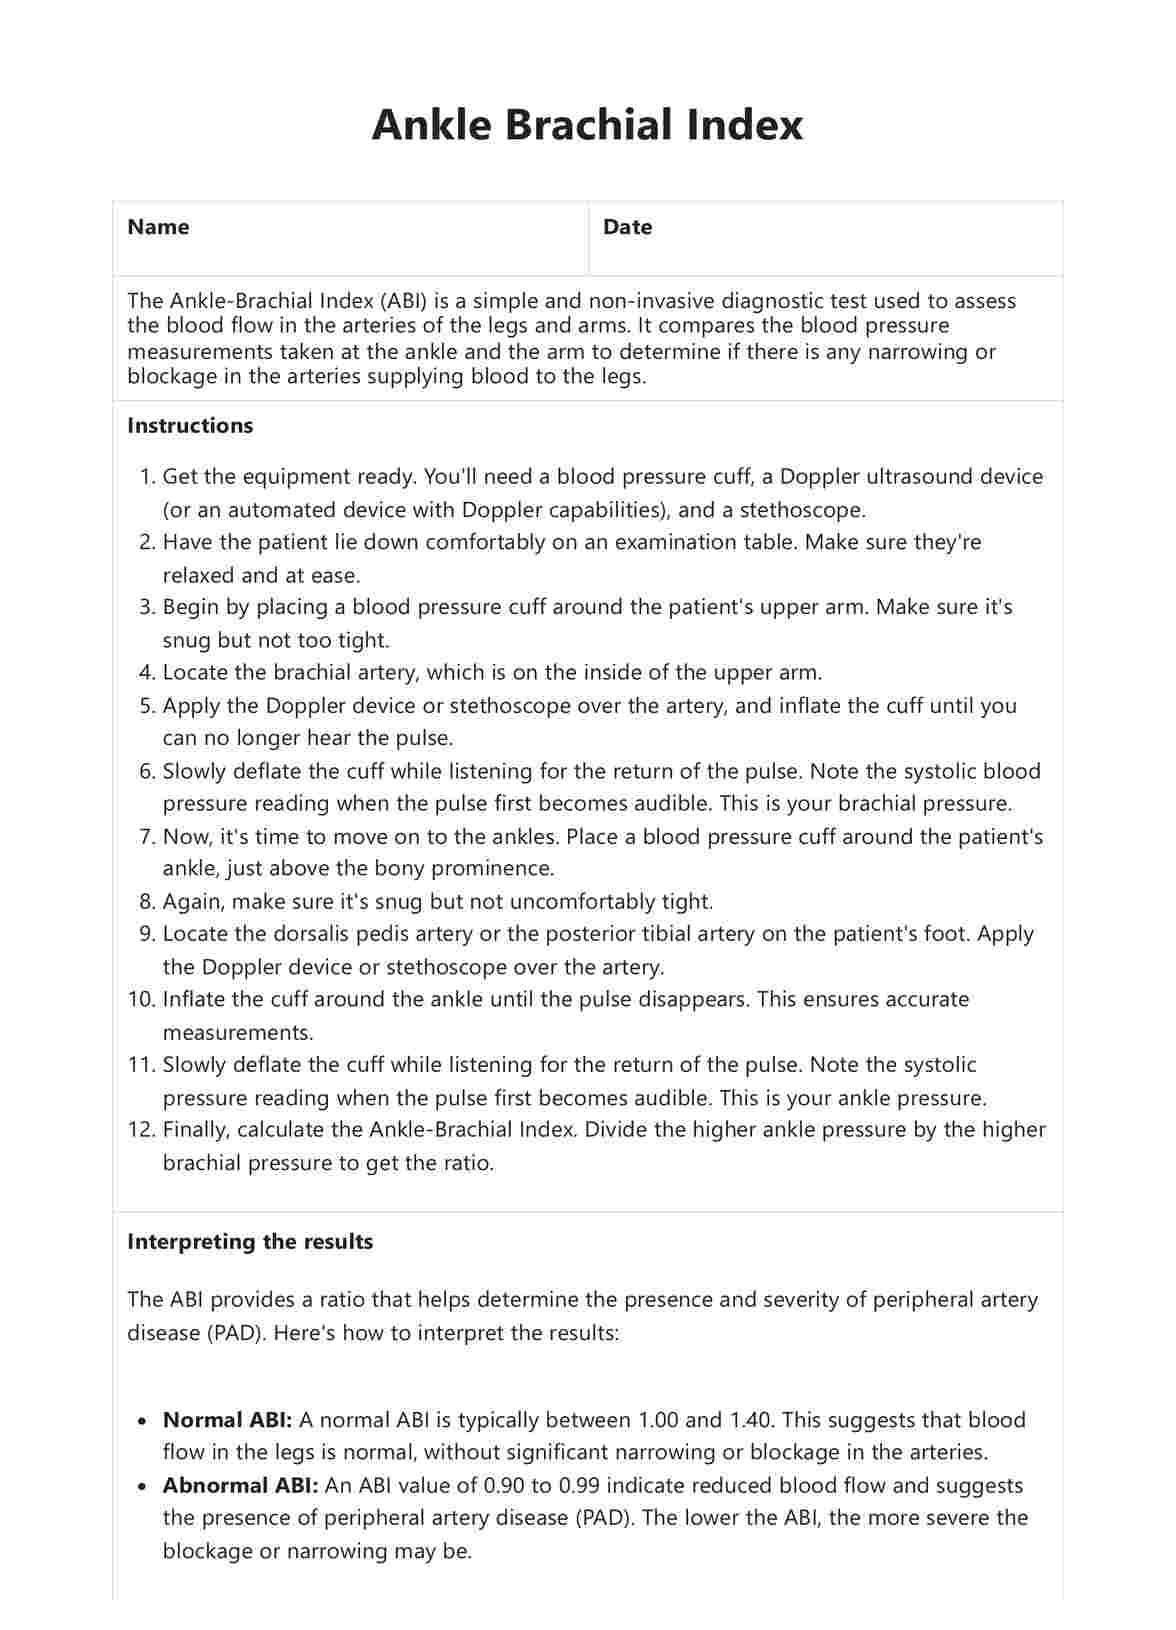
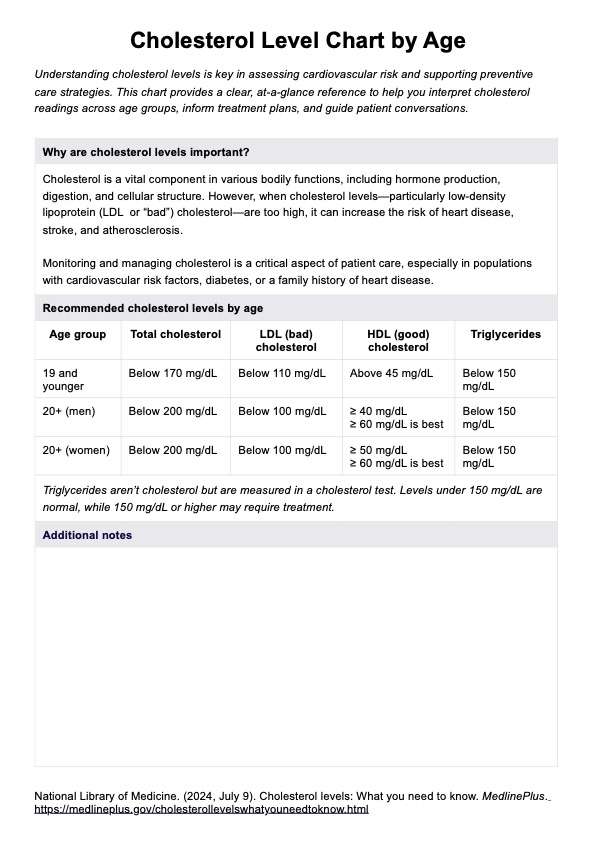
Recommended cholesterol levels vary by age and sex, with specific thresholds guiding clinical interpretation. According to the U.S. National Library of Medicine (2024), desirable levels for individuals 19 and younger include total cholesterol below 170 mg/dL, LDL cholesterol below 110 mg/dL, and HDL cholesterol above 45 mg/dL.
For males 20 and older, total cholesterol should be less than 200 mg/dL, LDL below 100 mg/dL, and HDL at or above 40 mg/dL. The same targets apply to females aged 20 and older, with a slightly higher HDL goal of 50 mg/dL or more.
These charts help clinicians determine whether a patient falls within normal cholesterol levels, has high cholesterol, or is at risk of heart disease, coronary artery disease, or heart attack. As cholesterol levels vary with age and sex, age-specific charts allow for more accurate assessments of LDL cholesterol levels, HDL cholesterol, and other lipid markers.
How does this cholesterol levels chart work?
Carepatron’s Cholesterol Level Chart by Age is designed for quick, practical use in clinical settings. It streamlines cholesterol assessment by offering clear benchmarks based on age and sex, making it easier to interpret results and guide patient conversations. Here’s how to use it effectively in your workflow.
Step 1: Access the chart handout
Click the “Use template” button to access the Cholesterol Level Chart by Age directly through Carepatron. You can customize or immediately begin using the chart for your clinical patient consults. You can also download a PDF version by choosing "Download."
Step 2: Introduce the chart to the patient
During your consultation, explain that the chart helps categorize cholesterol levels based on age and sex. Emphasize that it provides a quick reference to understand where their LDL, HDL, total cholesterol, and triglycerides fall about clinical guidelines.
Step 3: Discuss how the chart works
Guide the patient through each section of the chart. Explain how these ranges are used to assess cardiovascular risk, considering individual risk factors such as family history, blood pressure, and existing conditions like diabetes or high cholesterol.
Step 4: Provide the patient next steps to take
Based on their cholesterol readings, offer tailored recommendations—this may include lifestyle modifications, dietary changes, or further testing. If necessary, discuss initiating cholesterol-lowering medication or scheduling follow-up lab work. Use the chart to outline the rationale behind each suggested intervention.
Benefits of using this chart
Using the blood Cholesterol Level Chart by Age offers several practical benefits for medical professionals aiming to streamline cardiovascular risk assessment and patient education. It provides a clear reference for evaluating total blood cholesterol, LDL cholesterol ranges, HDL, and triglycerides based on age and sex, allowing clinicians to interpret results quickly during consultations.
This chart supports the early identification of high cholesterol and high blood cholesterol, making it easier to flag patients with a higher risk of heart disease, especially when combined with other risk factors such as high blood pressure, obesity, or a poor diet high in processed foods and saturated fats. It also simplifies decisions around recommending cholesterol-lowering medication or implementing lifestyle and dietary changes.
By referencing the chart, a healthcare provider can explain whether a patient's numbers fall within the normal range, reinforcing why the lower your risk, the better. This tool aligns with recommendations from authorities, helping clinicians ensure consistency and clarity across care plans.
References
Centers for Disease Control and Prevention. (2024). LDL and HDL cholesterol and triglycerides. Cholesterol. https://www.cdc.gov/cholesterol/about/ldl-and-hdl-cholesterol-and-triglycerides.html
National Library of Medicine. (2024, July 9). Cholesterol levels: What you need to know. MedlinePlus. https://medlineplus.gov/cholesterollevelswhatyouneedtoknow.html
Commonly asked questions
For anyone 19 or younger, healthy total cholesterol is less than 170 mg/dL. For adults 20 or older, both men and women should aim for total cholesterol levels below 200 mg/dL.
For men 20 or older, a healthy HDL is 60 mg/dL or higher, and LDL should be less than 100 mg/dL. For women, HDL should also be 60 mg/dL or higher and LDL less than 100 mg/dL; levels lower than 40 mg/dL for men and 50 mg/dL for women are considered low.
High cholesterol typically doesn’t show symptoms, but warning signs can include chest pain, heart attack, stroke, pain while walking, and yellowish deposits around the eyes (xanthomas). Regular blood tests are the best way to detect it.
Related Templates

Popular Templates