Blood Sugar Weight Loss Chart
Get a free blood sugar weight loss chart template and example PDF for tracking progress in managing levels and achieving weight loss goals. Stay well-balanced!
What is a Blood Sugar Weight Loss Chart?
A blood sugar weight loss chart is a valuable tool designed to assist individuals in effectively managing their blood sugar levels while pursuing weight loss goals. This resource combines two essential aspects of health – blood sugar regulation and weight management – providing a comprehensive approach to overall well-being.
This chart typically includes columns for recording daily meals, snacks, and corresponding blood sugar readings. Users can also track physical activity, medication intake, and other factors influencing blood sugar levels and weight. By consistently inputting data, individuals understand the correlation between their dietary choices, physical activity, and blood sugar fluctuations.
Moreover, a blood sugar weight loss chart serves as a visual aid, offering a tangible representation of progress over time. It empowers individuals to make informed decisions about their lifestyle, enabling them to refine their approach for optimal results. Whether you aim for weight loss, maintaining blood sugar levels, or both, this chart is a personalized roadmap to improved health and wellness.
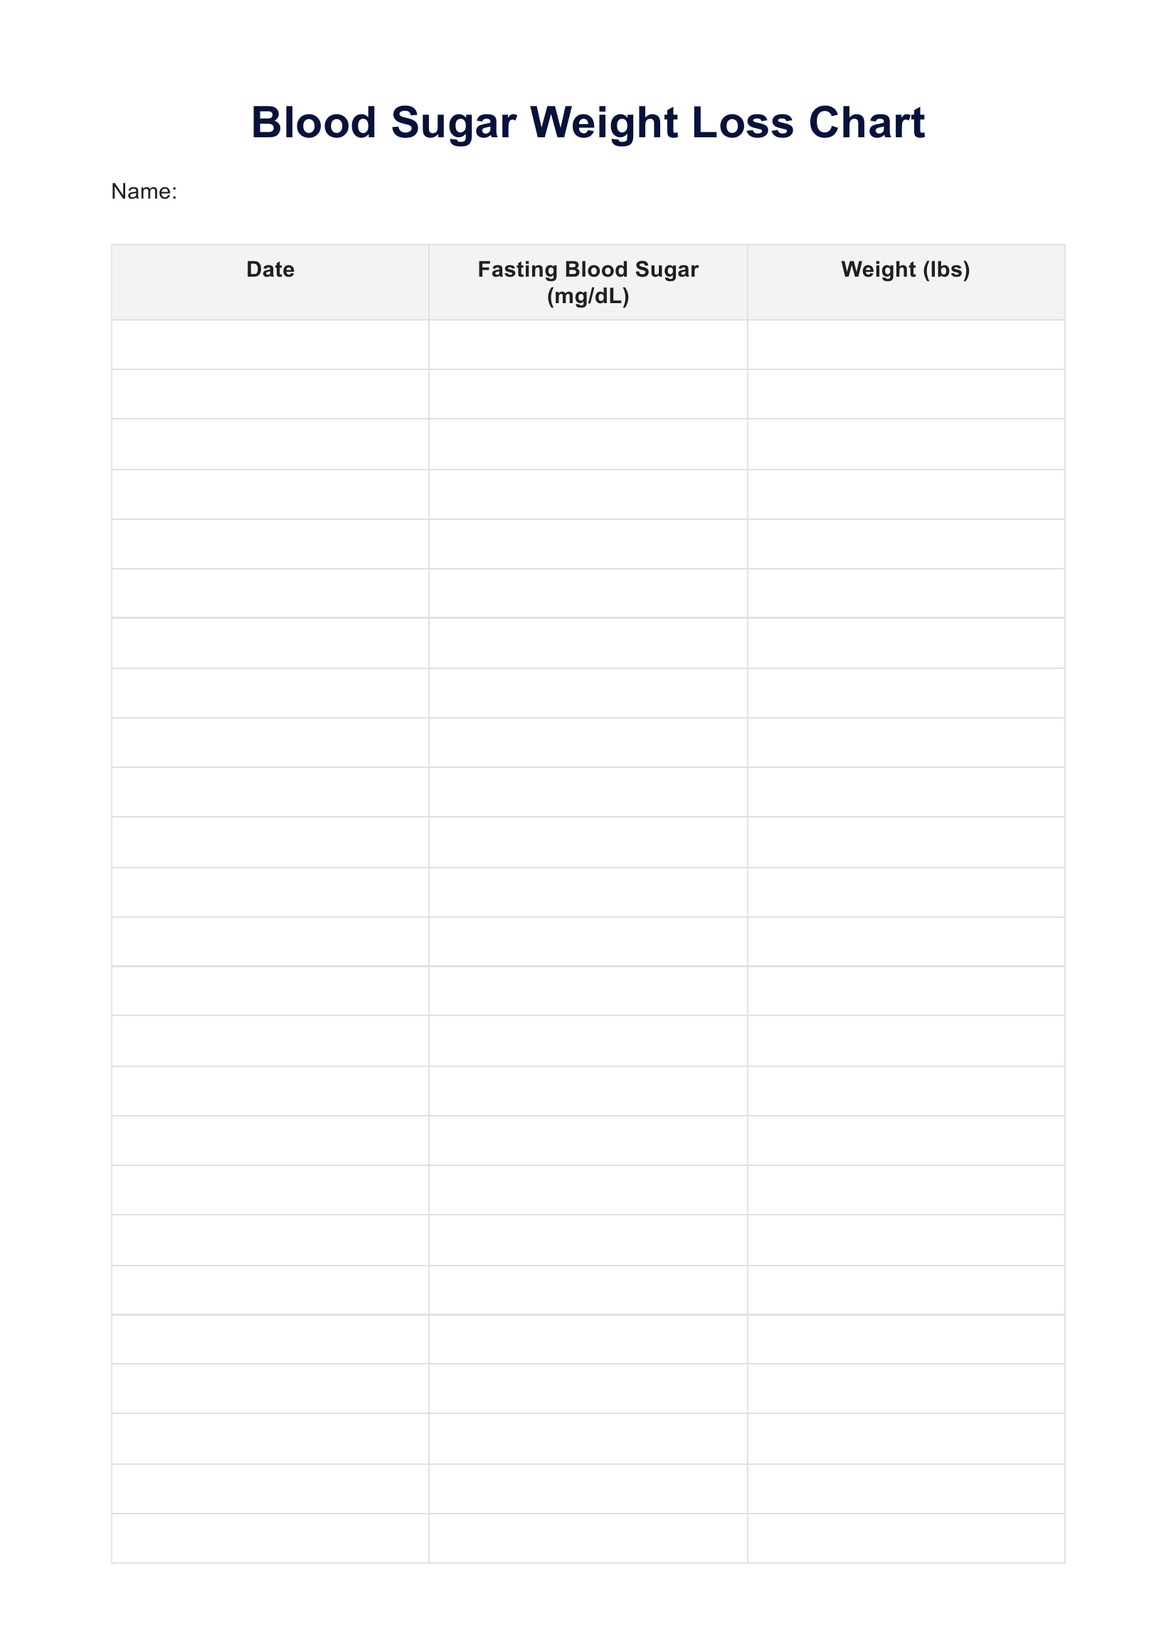
Blood Sugar Weight Loss Chart Template
Blood Sugar Weight Loss Chart Example
How does it work?
A blood sugar weight loss chart operates as a dynamic tool, guiding users through a structured process that integrates tracking, analysis, and goal-setting for effective health management. Here's a step-by-step guide on utilizing this resource to its fullest:
Step 1 - Access a printable Blood Sugar Weight Loss Chart template
Begin by downloading a printable blood sugar weight loss chart template. Numerous resources online provide customizable templates tailored to individual preferences. Look for a user-friendly design that includes sections for meals, snacks, physical activity, and blood sugar readings.
Step 2 - Input daily data
Consistently fill in the chart with details of your daily meals, snacks, and respective blood sugar readings. Note the time of day, portion sizes, and any medications taken. This meticulous record-keeping lets you identify patterns and correlations between lifestyle choices and blood sugar levels.
Step 3 - Analyze trends and adjust
Regularly review the completed chart to identify trends. Observe how specific foods, activities, or times of day impact your blood sugar and weight. Use this data to make informed adjustments to your lifestyle, creating a personalized strategy that aligns with your health goals.
When would you use this template?
The Carepatron blood sugar weight loss chart template proves indispensable for individuals seeking a holistic approach to managing blood sugar levels and achieving weight loss goals. Tailored to meet the needs of diverse users, this versatile template finds its application in various scenarios, offering a valuable resource for:
Personal health management
Individuals aiming to take control of their health and well-being can benefit significantly from this template. Whether navigating diabetes management or striving for weight loss, the comprehensive nature of the chart aids in tracking daily habits, identifying patterns, and making informed decisions to optimize health outcomes.
Healthcare professionals
Health practitioners, dietitians, nutritionists, and diabetes educators, can integrate this template into patient care strategies. The detailed insights provided by the chart empower practitioners to offer personalized advice and interventions, fostering a collaborative approach to patient well-being.
Fitness and wellness coaches
This template is a valuable tool for fitness and wellness coaches to guide clients on their health journey. By tracking physical activity and its impact on blood sugar levels and weight, coaches can tailor exercise routines and nutritional recommendations with greater precision.
Research and studies
Researchers focused on the interplay between blood sugar regulation and weight management can utilize this template in clinical studies and observational research. The standardized format facilitates data collection and analysis, contributing to a deeper understanding of lifestyle factors influencing health outcomes.
What do the results mean?
Understanding the implications of your blood sugar weight loss chart results is crucial for making informed decisions about your health. Here are some common outcomes and their interpretations:
Stable blood sugar levels
Achieving stable blood sugar levels is a positive indicator of effective management. Consistent readings within the target range suggest that dietary and lifestyle choices support balanced glucose levels. This stability is fundamental not only for overall health but also for weight management.
Fluctuations in blood sugar
If you notice fluctuations in blood sugar readings, examining the corresponding entries in your chart is essential. Identify patterns related to specific meals, activities, or times of day. Fluctuations could indicate the need for adjustments in your diet or medication to maintain more consistent blood sugar levels.
Weight loss plateau or gain
The correlation between weight loss or gain and blood sugar levels is critical to the chart. A plateau in weight loss could signal the need to reassess your calorie intake or exercise routine. On the other hand, unexpected weight gain may prompt a closer examination of dietary choices and their impact on blood sugar regulation.
Consistent physical activity and its impact
Observing the relationship between physical activity and blood sugar readings is key. Consistent exercise is often associated with improved blood sugar control and weight management. If your chart reflects positive outcomes in this regard, it signifies the effectiveness of your fitness routine.
Research & evidence
The concept of blood sugar and its connection to weight management predates the modern medical understanding of diabetes. According to a study by Magriplis, Michas, Petridi, et al. (2021), ancient Greek physicians observed the link between excessive sugar intake and weight gain and even attempted to treat obesity through dietary restrictions. However, it wasn't until the 18th century that scientists began to unravel the biological mechanisms involved.
In 1776, a British physician, Matthew Dobson, conducted groundbreaking experiments demonstrating the presence of sugar in the blood. According to Karamanou (2016) identified a sweet-tasting substance in the blood of diabetic patients, which he named "diabetic sugar." This discovery laid the groundwork for future research on blood sugar regulation and diabetes.
Throughout the 19th and early 20th centuries, advances in biochemistry led to a deeper understanding of glucose metabolism and its role in energy production. Scientists like Claude Bernard and Oskar Minkowski further investigated the role of the pancreas in insulin production and its impact on blood sugar levels.
In the 1920s, Frederick Banting and Charles Best successfully isolated and purified insulin, paving the way for revolutionary treatments for diabetes. This discovery transformed the lives of millions of people and opened new avenues for exploring the relationship between blood sugar and weight.
Maintaining healthy blood sugar levels is essential for preventing type 2 diabetes, which is a major risk factor for obesity, heart disease, and other chronic conditions. By understanding how food choices and lifestyle habits affect blood sugar, individuals can make informed decisions to control their weight and reduce their risk of diabetes.
Blood sugar levels play a significant role in regulating hunger and satiety. Spikes in blood sugar, often caused by sugary and processed foods, can increase cravings and overeating. Conversely, maintaining stable blood sugar levels through a balanced diet and regular exercise promotes fullness and reduces the urge to snack.
The history of blood sugar and weight loss reveals a fascinating journey of scientific discovery and medical advancements. Understanding this relationship remains critical today for individuals and public health initiatives to prevent diabetes, manage weight, and optimize metabolic health for a longer and healthier life.
References
Magriplis, E., Michas, G., Petridi, E., Chrousus, G.P., Roma, E., Benetou, V., Cholopoulos, N., Micha, R., Panagiotakos, D., Zampelas, A. (2021). Dietary sugar intake and its association with obesity in children and adolescents. https://www.ncbi.nlm.nih.gov/pmc/articles/PMC8391470/
Karamanou, M. (2016). Milestones in the history of diabetes mellitus: the main contributors. https://www.ncbi.nlm.nih.gov/pmc/articles/PMC4707300/
Commonly asked questions
Creating a Blood Sugar Weight Loss Chart template is simple. Begin by categorizing columns for meals, snacks, physical activity, and blood sugar readings.
These templates are used daily to track meals, monitor blood sugar levels, and record physical activity. Regular use ensures a comprehensive overview of your health habits, aiding in identifying patterns and trends.
Utilize the templates by consistently inputting data on meals, snacks, exercise, and blood sugar readings. Regular analysis of the completed chart allows you to make informed decisions about your health and adjust your lifestyle accordingly.