Rheumatoid Factor Chart
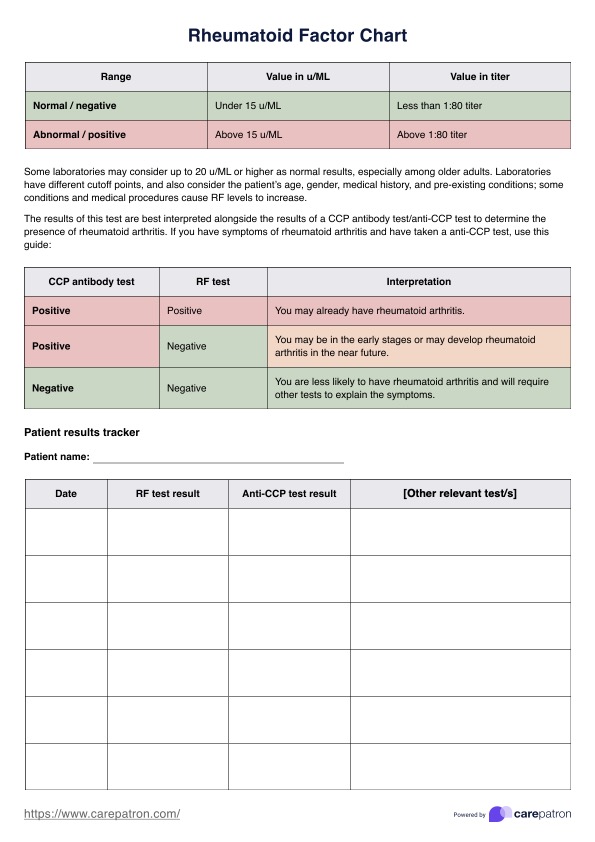
Use our Rheumatoid Factor Chart for teaching patients to easily understand RF blood test results and documenting RF levels over time.


What is a Rheumatoid Factor Chart?
A Rheumatoid Factor (RF) Chart is a visual tool designed to help healthcare providers explain RF test results to patients and track these levels over time. RF refers to autoantibodies produced by the immune system. These are called rheumatoid factors, and they include IgM RF, IgG, and IgA. These antibodies are often measured in a rheumatoid factor test, which is primarily used to diagnose rheumatoid arthritis but can also indicate other autoimmune diseases and certain chronic infections.
In rheumatoid arthritis (RA), the immune system mistakenly attacks the body's own tissues, causing inflammation in the joints and, over time, joint damage. Since RA is complex, practitioners rely on various rheumatoid arthritis lab tests in conjunction with the RF test, including the anti-cyclic citrullinated peptide (anti-CCP) antibody test. The presence of rheumatoid factor (RF) in higher levels may suggest RA, though elevated RF can also appear in other autoimmune diseases such as Sjogren's syndrome and connective tissue diseases.
The RF chart also provides a reference for different RF levels, helping to identify cases that may require further investigation. For instance, while RF can indicate rheumatoid arthritis, it may also appear in chronic infections or certain cancers. Using this chart also allows providers to consider other test results in their interpretation, making it easier to diagnose rheumatoid arthritis or rule out other potential causes; after all, RF test results on their own are usually insufficient for an RA diagnosis.
Rheumatoid Factor Chart Template
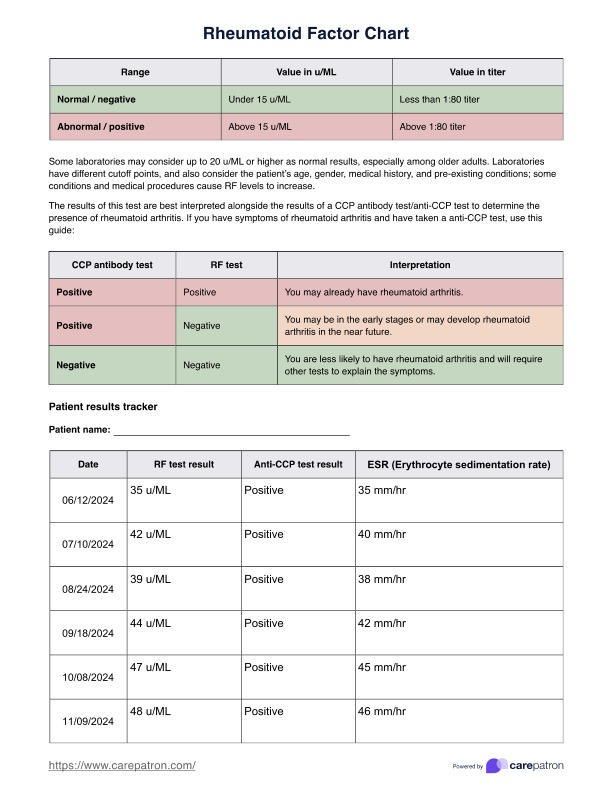
Rheumatoid Factor Chart Example
How to use our Rheumatoid Factor Chart template
Our Rheumatoid Factor Chart template includes fields for healthcare professionals to document patients’ RF levels and a guide for interpreting results, making patient communication easier. Follow these steps to make the most of this resource:
Step 1: Access the template
Download the template by clicking "Use template" to open it in the Carepatron app, where you can customize, share, and print it. Alternatively, click "Download" to save a fillable, non-customizable PDF version.
Step 2: Perform the rheumatoid factor blood test
Collect a blood sample from the patient to determine RF levels. This rheumatoid factor blood test may be part of a panel with other tests to help diagnose RA or monitor autoimmune conditions.
Step 3: Record and interpret test results
Record the patient’s rheumatoid factor test results in the template. Generally, RF values under 15 u/ML (or below a 1:80 titer) are considered negative, while values above 15 u/ML (or over a 1:80 titer) are positive. Some labs may consider up to 20 u/ML as normal, especially in older adults. In addition, other pre-existing conditions and medication affect RF levels; therefore, it’s essential to interpret these numbers in the context of the patient’s overall health history and demographic factors (MedlinePlus Medical Encyclopedia, n.d.).
While a positive or negative RF result offers initial insights, it is best interpreted in conjunction with CCP antibody test results, as these provide a fuller picture:
- Positive RF and positive CCP: This combination strongly suggests rheumatoid arthritis, especially when accompanied by symptoms (Nielsen et al., 2012). It is highly indicative of an established RA diagnosis, so the next step is to confirm the condition with other tests and direct specific treatment.
- Negative RF and positive CCP: Often, this result implies early or seronegative RA, where CCP antibodies may precede RF levels. Consider this combination a potential early marker of RA, warranting close monitoring or early intervention based on symptoms.
- Negative RF and negative CCP: This combination makes RA less likely and suggests that other diagnoses may explain any rheumatoid arthritis symptoms the patient is experiencing. Explore alternative causes, such as other autoimmune or inflammatory conditions.
Document the interpretation clearly in the patient’s records, noting any contextual factors or recommendations based on the results, and prepare to discuss the findings with the patient in the next step.
Step 4: Discuss results with the patient
Using the chart, explain whether their RF levels indicate a high rheumatoid factor or fall within normal ranges. Provide insights on what these values may suggest regarding their health, as well as next steps based on RF and CCP results.
When would you use this chart?
The Rheumatoid Factor Chart proves invaluable in a variety of clinical situations, helping you efficiently interpret, monitor, and communicate rheumatoid factor results with patients. Here are key scenarios where you may find this tool particularly useful:
- Confirming a diagnosis: Use this chart when a patient presents with symptoms of rheumatic disease. It allows you to interpret RF test results in context, helping you diagnose rheumatoid arthritis and differentiate it from other potential conditions.
- Supporting differential diagnosis: In cases where symptoms might overlap with other connective tissue diseases or chronic infections, you can use this chart to document and evaluate RF results as part of a broader differential diagnosis approach.
- Monitoring treatment response: For patients undergoing treatment for rheumatoid arthritis or other autoimmune conditions, the chart helps you track RF levels over time. Consistent documentation can reveal changes in disease activity, indicating whether a treatment plan is effective or requires adjustment.
- Risk stratification: When you encounter patients with high rheumatoid factor levels and signs of a more aggressive disease, this chart aids in stratifying risk. It helps you identify those needing closer monitoring or more intensive interventions to manage joint pain and other symptoms.
- Educating patients: The visual nature of the chart facilitates patient education. It makes it easier for you to explain RF test results, the implications of varying RF levels, and the importance of follow-up tests or further assessment.
By using the Rheumatoid Factor Chart in these contexts, you can enhance patient care, improve communication, and ensure more effective documentation for managing autoimmune disorders.
References
MedlinePlus Medical Encyclopedia. (n.d.). Rheumatoid factor (RF). National Library of Medicine. Retrieved November 8, 2024, from https://medlineplus.gov/ency/article/003548.htm
Nielsen, S. F., Bojesen, S. E., Schnohr, P., & Nordestgaard, B. G. (2012). Elevated rheumatoid factor and long term risk of rheumatoid arthritis: a prospective cohort study. BMJ, 345(sep06 2), e5244–e5244. https://doi.org/10.1136/bmj.e5244
Commonly asked questions
A normal or negative rheumatoid factor (RF) result is typically under 15 u/mL or less than a 1:80 titer, although some laboratories may consider up to 20 u/mL normal, especially for older adults.
RF results above the normal range may suggest rheumatoid arthritis or another autoimmune disease, especially if paired with a positive anti-CCP antibody test. A positive RF alone, however, does not confirm a diagnosis and is best interpreted alongside other lab tests and patient symptoms.
Reducing RF levels may involve managing underlying conditions such as rheumatoid arthritis with anti-inflammatory medications, lifestyle changes like regular exercise, and, in some cases, disease-modifying drugs. Consult a healthcare provider for personalized recommendations.


