Normal ECG Values Charts
Understand the basics of an ECG with our handy Normal ECG Values Chart. Download our free PDF today to learn more!

Fact Checked by Nate Lacson.


What is a Normal ECG Values Chart?
An electrocardiogram (ECG), also known by the initials "EKG," is a measurement of the electrical activity of the heart. It is used to detect abnormal rhythms of the heart, such as arrhythmia, and can help diagnose conditions like congestive heart failure, cardiac hypertrophy, or an enlarged left ventricle. The ECG measures the heart's electrical activity by assessing the voltage or current changes in the chest area. A graph is then created that displays the electrical activity of the heart.
An ECG can provide valuable information about a person's overall cardiovascular health and is often used to monitor patients with existing cardiovascular conditions. It can also indicate if a person has experienced recent events, such as a heart attack.
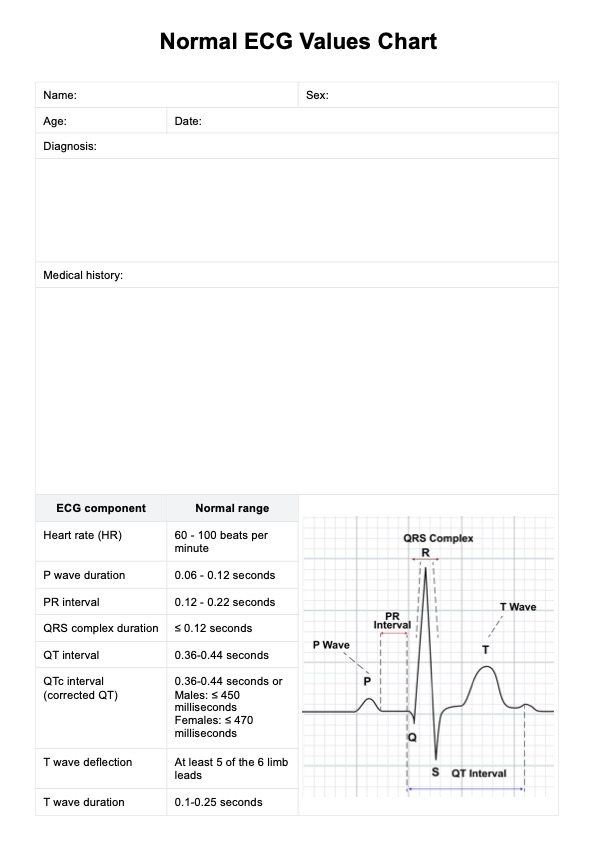
A Normal ECG Values Chart is used to interpret ECG results. This chart contains commonly accepted values for normal ECG readings, which can then be compared against the patient's results to determine if any irregularities exist.
While the Normal ECG Values Chart can help diagnose and monitor patients, it is important to remember that each patient is unique and may present with abnormal ECG readings differently. In such cases, further testing or more specialized evaluations may be necessary to better understand the patient's health. Additionally, ECG readings can vary depending on age, gender, and other individual factors.
Normal ECG Values Charts Template
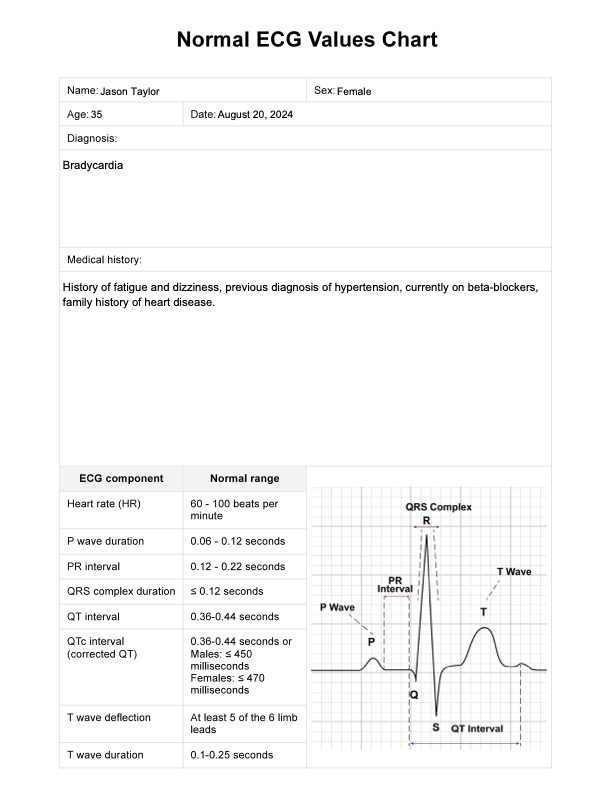
Normal ECG Values Charts Example
How to use our Normal ECG Values Chart template
Our free, printable Normal ECG Values Chart template includes reference ranges to help you quickly identify abnormal ECG readings. Follow these steps to get started:
Step 1: Download the chart
Access the free Normal ECG Values Chart using the "Use template" button on this page. You can also download it from our resources library by clicking "Download."
Step 2: Explain how this form works
Share the chart with your patient and explain how you read it. Point out the sections showing the ECG readings and their normal ranges.
Step 3: Enter the patient's data
Fill in the appropriate data fields with information about your patient. This includes their age, gender, and other relevant information.
Step 4: Have the patient undergo an electrocardiogram test
You need the results of an ECG/EKG, so prepare your patient for the procedure and administer the test. Once done, record the results.
Step 5: Review the results
Examine the chart and use our template as reference. to see how your patient's ECG readings compare to the normal values. Based on the information provided, evaluate the patient's condition.
Step 6: Discuss the results with your patient
Discuss the plan with your patient and answer any questions they may have. Be sure to provide clear instructions and emphasize the importance of following through with the plan.
How to read ECG results
Reading an ECG involves analyzing several components to assess the heart's electrical activity and determine if it is functioning properly. Below are the key elements you should evaluate:
- Heart rate (HR): Calculate the heart rate by counting the number of R waves in a 6-second strip and multiplying by 10. A normal heart rate ranges from 60 to 100 beats per minute.
- P wave: The P wave represents atrial depolarization. Assess the P wave morphology and duration (0.06-0.12 seconds). The P waves should be upright in lead II and uniform in appearance. Abnormal P waves may suggest atrial enlargement or atrial fibrillation.
- PR interval: Measure the time from the start of the P wave to the start of the QRS complex. A normal PR interval ranges from 0.12 to 0.22 seconds. A prolonged PR interval may indicate first-degree heart block, while a shortened PR interval could be associated with pre-excitation syndromes.
- QRS complex: The QRS complex represents ventricular depolarization. The duration should be ≤ 0.12 seconds. Abnormalities in the QRS complex, such as wide complexes, may indicate bundle branch blocks or ventricular hypertrophy. The R wave amplitude should be examined, especially in cases of left ventricular hypertrophy, where it may be increased.
- ST segment: The ST segment is the flat, isoelectric section of the ECG following the QRS complex. Evaluate for ST segment elevation or depression, which could indicate myocardial ischemia or infarction. ST segment depression may also be seen in conditions like left ventricular hypertrophy or strain patterns.
- T wave: The T wave represents ventricular repolarization. A normal T wave is upright in most leads, especially in lead II. However, T wave inversion or negative deflection may be a sign of myocardial ischemia or other cardiac abnormalities. Assess the T wave duration, which normally ranges from 0.1 to 0.25 seconds.
- QT interval: Measure the QT interval from the start of the Q wave to the end of the T wave. Correct the QT interval (QTc) for heart rate using Bazett’s formula, with normal QTc values ranging from 0.36 to 0.44 seconds. Prolonged QT intervals may suggest an increased risk of ventricular arrhythmias.
- U wave: The U wave follows the T wave and represents the final phase of ventricular repolarization. The normal U wave is small and upright in the same lead as the T wave. Prominent U waves can be seen in conditions like hypokalemia.
- Q waves: Assess for the presence of Q waves, which may indicate a previous myocardial infarction if they are deep and wide.
- Atrial flutter and fibrillation: Evaluate for any signs of atrial flutter, characterized by a "sawtooth" pattern of P waves, or atrial fibrillation, where P waves are replaced by erratic baseline fluctuations.
- J point: The J point is where the QRS complex transitions into the ST segment. Elevation or depression at this point can be significant in diagnosing conditions like myocardial infarction.
Recognizing normal variants, such as a biphasic P wave or slight variations in QRS duration, is crucial to avoid over-interpreting benign findings. Always consider the patient's clinical context and medical history when interpreting ECG results.
When would you use this template?
The Normal ECG Values Chart template measures the electrical activity of a patient's heart. It can help you evaluate and diagnose possible medical conditions or diseases, such as abnormal rhythms or heart blockages. Similarly, you can utilize this chart to:
Monitor the effect of medication for heart conditions
You can use this free Normal ECG Values Chart to keep track of patient readings over time and evaluate the effects of any medications or treatments they are taking for a heart or rhythm-related condition. This helps you track progress and adapt treatments if needed.
Identify potential problems or irregularities
This chart will help you identify any irregularities in the patient's heartbeat or other cardiac readings. If you notice any inconsistencies, you can investigate further and determine if the patient is at risk for a heart attack, myocardial infarction, ventricular hypertrophy, or other serious condition.
Compare the patient's ECG with normal values
By comparing the patient's ECG with the normal values on this chart, you can quickly identify any problems or abnormalities. This helps you determine the best course of action and take preventive measures.
Who is this free Normal ECG Values Chart for?
Most healthcare professionals can use our free Normal ECG Chart for patient monitoring and diagnosis. This chart is especially useful for:
- Cardiologists
- Nurses
- Technicians
- Primary care doctor
- Emergency room physicians
Students and medical researchers can also use this chart to understand the normal values of ECG waveforms.
Commonly asked questions
Normal electrocardiogram (ECG) values include a heart rate of 60-100 beats per minute, a PR interval of 0.12-0.22 seconds, a QRS complex duration of ≤ 0.12 seconds, and a QT interval of 0.36-0.44 seconds, among others, as outlined in our template.
Abnormal electrocardiogram (ECG) readings may include prolonged QT intervals, ST segment elevation or depression, T wave inversion, and abnormal QRS complex duration, all of which could indicate underlying cardiac conditions.
The most common electrocardiogram (ECG) problems include atrial fibrillation, ventricular hypertrophy, myocardial infarction, and heart blocks, all of which can be detected through careful analysis of the ECG components.
Related Templates

Popular Templates