Iron Levels Chart For Adults
Download an Iron Levels Chart for adults - a comprehensive tool for tracking and interpreting iron-related test results. Ensure optimal iron health.

Fact Checked by Ericka Pingol.


What Is an Iron Levels Chart For Adults?
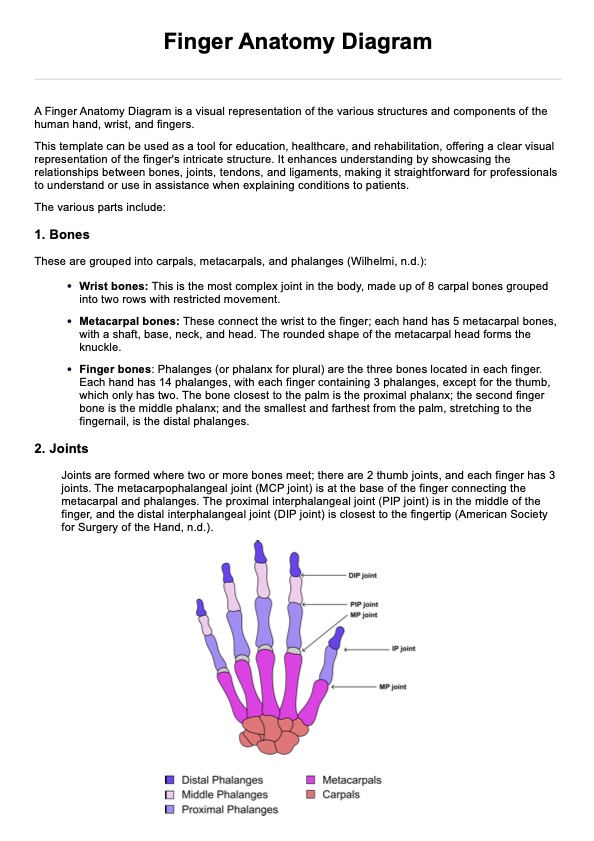
An iron levels chart for adults is a reference tool that indicates the recommended ranges of iron levels in the blood. Iron is essential for forming hemoglobin, which transports oxygen in the body. Proper iron levels are crucial for overall health, as deficiency or overload can have adverse effects.
These charts typically display a range of values considered normal or healthy for adults. Iron levels are usually measured through blood tests, which evaluate hemoglobin concentration and other markers like serum ferritin and transferrin saturation. The chart may include separate columns for men and women, as iron requirements can differ due to factors such as menstruation in women.
For adults, the typical range for hemoglobin levels varies but generally falls within the 13.8 to 17.2 grams per deciliter (g/dL) for men and 12.1 to 15.1 g/dL for women. Additionally, serum ferritin levels, which reflect the body's iron stores, may range between 12 to 300 nanograms per milliliter (ng/mL). These values can serve as guidelines for healthcare professionals to assess whether an individual is within a healthy iron range or may be experiencing an iron deficiency or overload.
These charts are valuable tools for healthcare providers in diagnosing and managing conditions related to iron metabolism, such as anemia or hemochromatosis. However, it's important to note that individual variations and specific health conditions may affect a healthy range for a particular person. Therefore, the interpretation of iron levels should always consider the individual's unique medical history and circumstances.
Regular check-ups, as well as discussions with a healthcare provider, can help individuals understand and manage their iron levels to ensure optimal health and well-being.
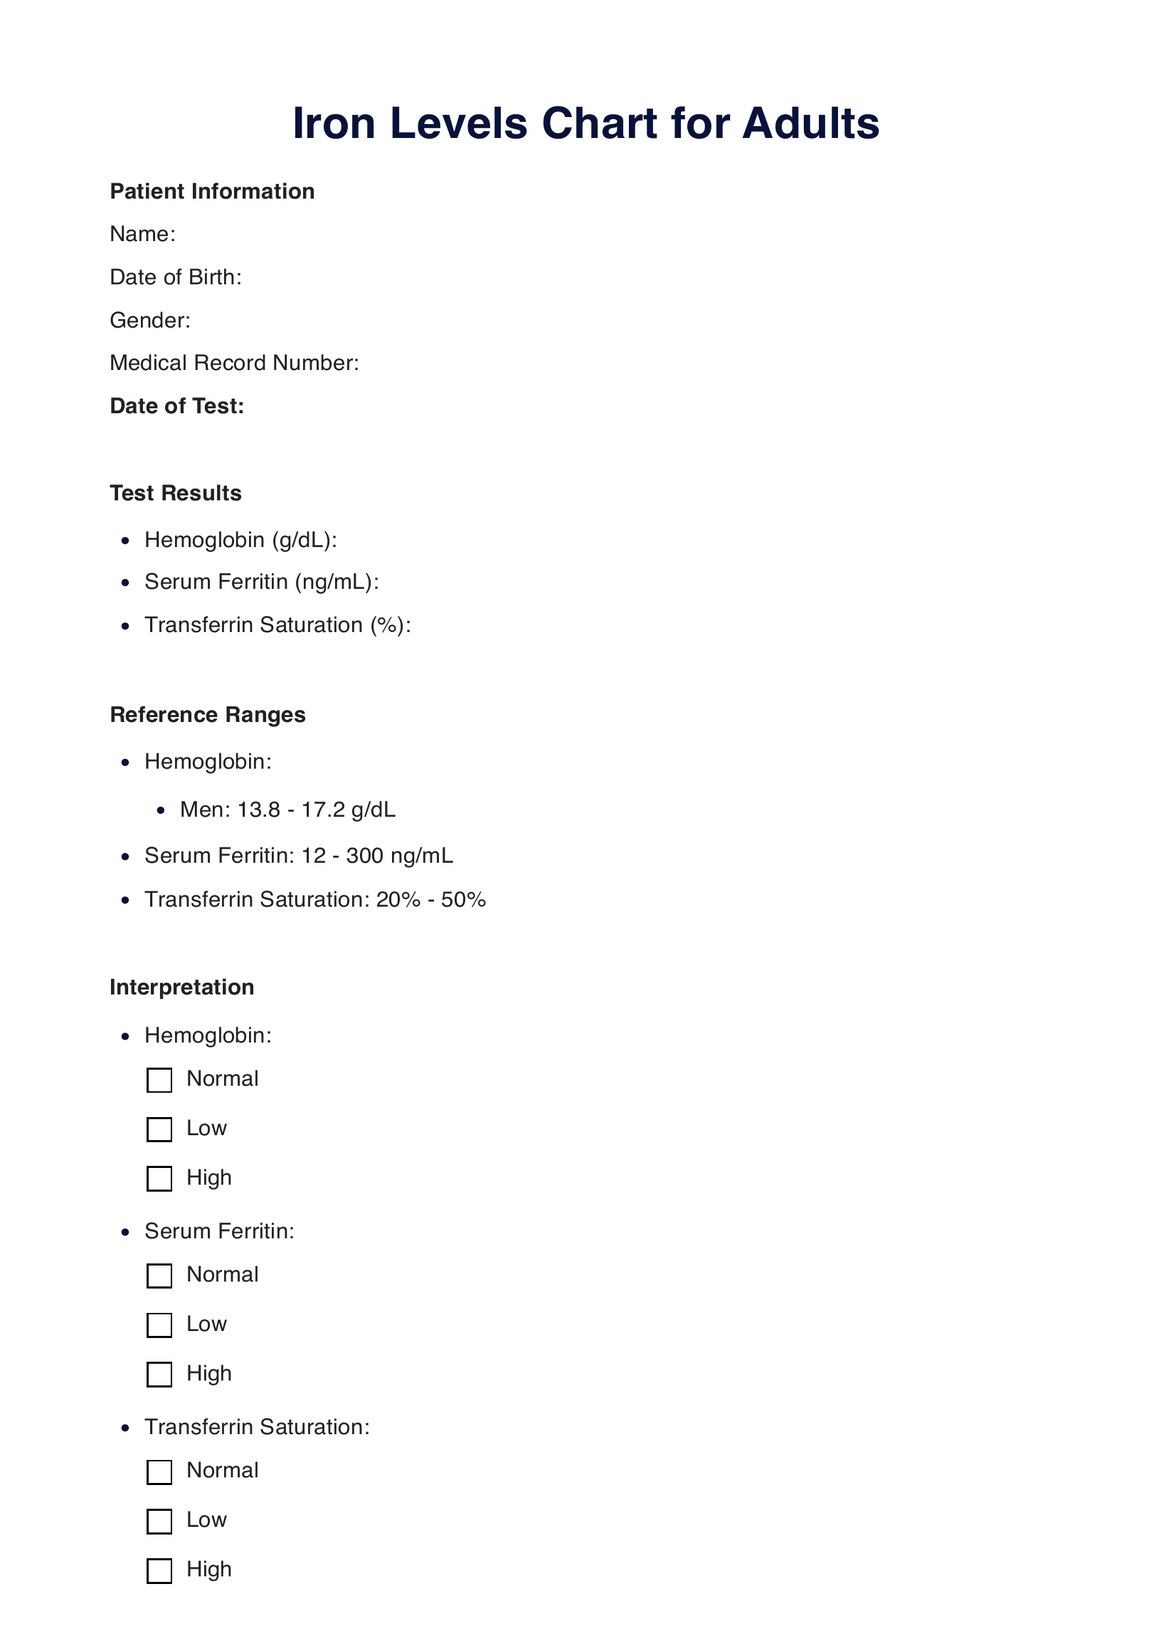
Iron Levels Chart For Adults Template
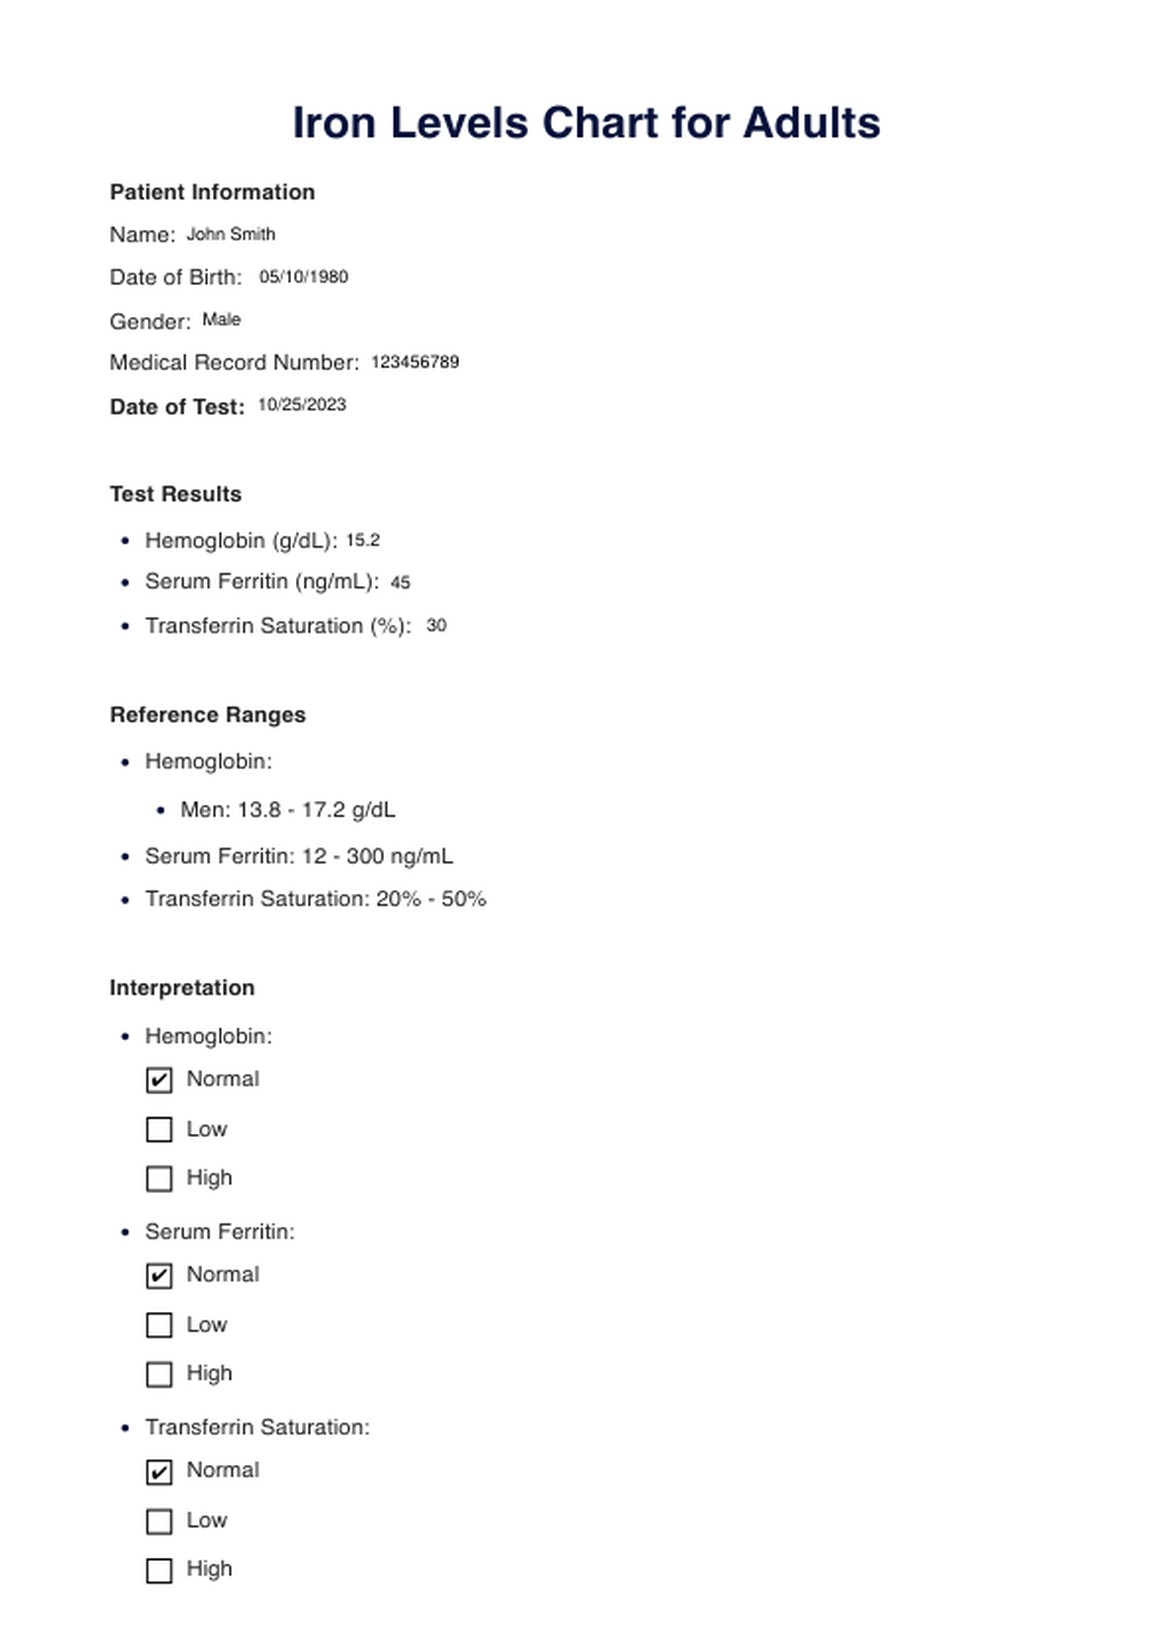
Iron Levels Chart For Adults Example
How Does it Work?
An iron levels chart can help monitor and interpret iron-related blood test results. The steps involved include filling out the chart and reviewing the results:
Step 1: Access the Chart
Begin by obtaining a printable iron levels chart designed for adults. These charts are often available from reputable medical websites, healthcare providers, or laboratories.
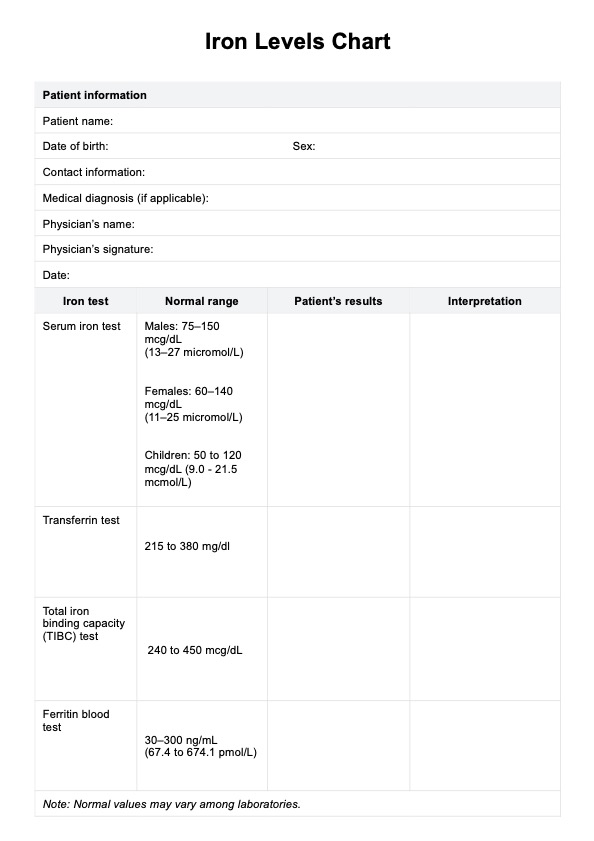
Step 2: Understand the Key Metrics
Familiarize yourself with the key metrics listed on the chart, which typically include hemoglobin levels, serum ferritin, and transferrin saturation.
Step 3: Obtain Blood Test Results
Visit a healthcare provider to have a blood test done to measure your iron levels. Ensure you receive a copy of the test results, which should include values for hemoglobin, serum ferritin, and transferrin saturation.
Step 4: Identify Your Results
Locate the sections on the chart that correspond to the specific iron-related metrics tested. For example, if you've had a hemoglobin test, find the hemoglobin section of the chart.
Step 5: Interpret Your Iron Levels
Compare your test results to the reference ranges provided on the chart. Results falling within the specified range are typically considered normal, while values outside this range may indicate an issue.
Step 6: Consult a Healthcare Professional
Suppose your results are outside the normal range. In that case, it's advisable to consult a healthcare professional, such as a doctor or a hematologist, to discuss your iron levels and determine appropriate actions or treatments.
Step 7: Record and Monitor
Use the chart to record your iron levels over time. Regular monitoring can help track changes and ensure that your iron levels remain within a healthy range.
Step 8: Follow Recommendations
Follow any recommendations or treatment plans provided by your healthcare provider to address iron-related issues, such as iron supplementation for deficiencies or therapeutic phlebotomy for iron overload.
When Would You Use This Chart?
The Iron Levels Chart for Adults is a valuable resource that finds applications in various clinical and healthcare settings. Here are some situations and scenarios where healthcare practitioners might use this chart:
- Routine Health Check-ups: Physicians and primary care providers can use the chart during regular check-ups to assess the iron status of their adult patients. This helps identify potential iron deficiencies or excesses, which may require intervention.
- Diagnosis of Anemia: Hematologists and general practitioners often use the chart when evaluating patients with suspected anemia. Anemia can result from low hemoglobin levels, and the chart assists in confirming and classifying this condition.
- Monitoring Chronic Illness: Patients with chronic diseases, such as inflammatory disorders or kidney disease, can experience fluctuations in their iron levels. Healthcare professionals can use the chart to track iron status and adjust treatment plans accordingly.
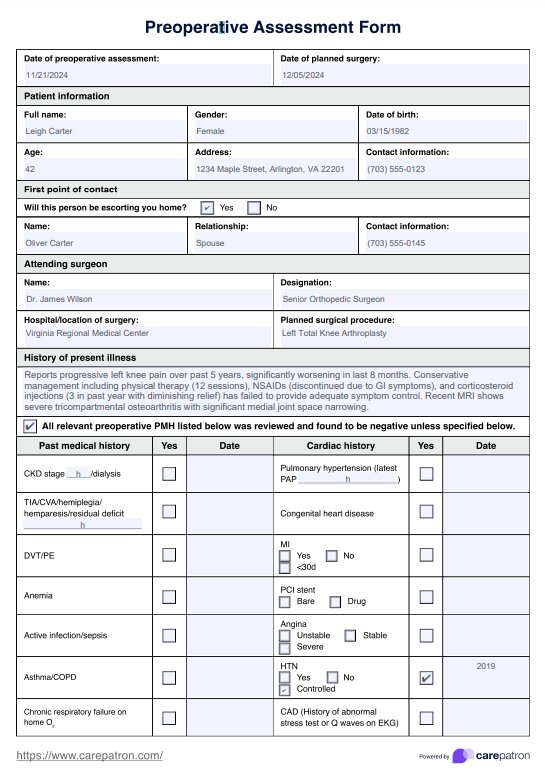
- Pre-operative Assessment: Surgeons and anesthesiologists may utilize the chart as part of pre-operative assessments to ensure that patients are in optimal condition for surgery, especially when significant blood loss is anticipated.
- Evaluation of Fatigue and Weakness: Patients reporting symptoms like fatigue and weakness can be assessed using the iron levels chart to rule out or diagnose iron-deficiency anemia, a common cause of these symptoms.
- Management of Hemochromatosis: For patients with hereditary hemochromatosis (iron overload disorder), healthcare providers may use the chart to monitor iron levels and guide therapeutic phlebotomy or other management strategies.
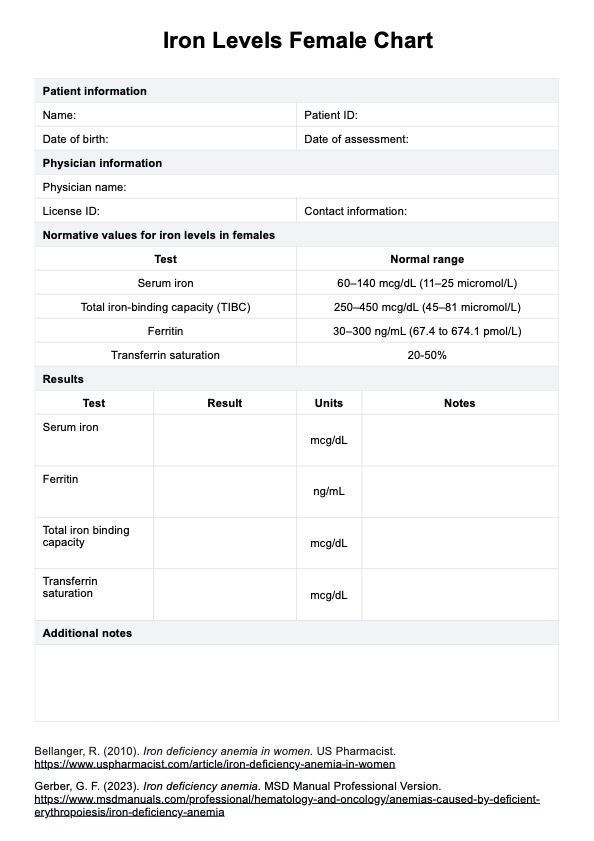
- Women's Health: Gynecologists and obstetricians might use the chart, particularly for female patients of childbearing age, to assess iron levels and address iron deficiencies that can occur due to menstruation and pregnancy.

What do the Results Mean?
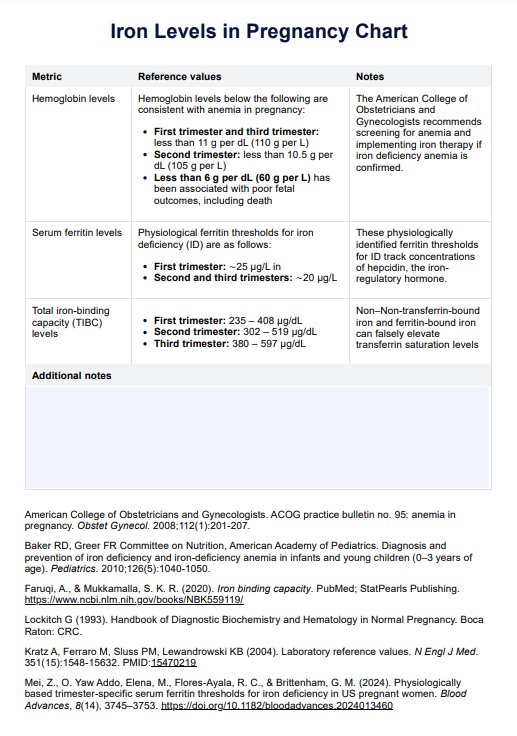
Hemoglobin Levels
For men, a typical range is 13.8 to 17.2 grams per deciliter (g/dL), while for women, it's 12.1 to 15.1 g/dL. Hemoglobin levels within this range suggest that the individual likely has enough iron for proper oxygen transport in the blood. Deviations from this range may indicate anemia (low levels) or polycythemia (high levels).
Serum Ferritin
Serum ferritin levels often fall between 12 to 300 nanograms per milliliter (ng/mL). Serum ferritin is a marker of iron stores in the body. Values within this range are generally considered healthy. Low ferritin can signal iron deficiency, while elevated levels may indicate iron overload or inflammation.
Transferrin Saturation
Transferrin saturation levels typically range from 20% to 50%. Transferrin saturation reflects the percentage of iron-binding sites on transferrin proteins occupied by iron. Values within the specified range are generally considered normal. Lower levels may indicate iron deficiency, while higher levels could be associated with hemochromatosis or excessive iron intake.
Abnormal Results
- Low Hemoglobin, Low Ferritin, and High Transferrin Saturation: These results may suggest hemochromatosis, where the body absorbs too much iron.
- Low Hemoglobin and Ferritin: Typically indicates iron-deficiency anemia, possibly due to inadequate iron intake, malabsorption, or chronic blood loss.
- High Hemoglobin and High Transferrin Saturation: This may indicate primary or secondary polycythemia, where there's an excess of red blood cells and iron.
Borderline Results
Results that fall on the borderline of the reference range should be considered in the context of an individual's overall health and medical history. Further investigation or retesting might be necessary to confirm the significance of these results.
Research & Evidence
Iron has been recognized as a vital mineral for human health for centuries. Historical texts dating back to ancient Greece and Rome documented the importance of iron in treating conditions like anemia.
The understanding of iron metabolism and its significance in the body continued to evolve. In the mid-20th century, breakthroughs in hematology and laboratory medicine led to the development of standardized blood tests for assessing iron levels.
The establishment of reference ranges for hemoglobin, serum ferritin, and transferrin saturation in adults is primarily based on extensive clinical research and studies involving large populations. Organizations like the World Health Organization (WHO) and the Centers for Disease Control and Prevention (CDC) have provided guidelines incorporating research findings to define normal or abnormal iron levels in adults.
Research has extensively explored iron-deficiency anemia, its prevalence, and its effects on health. Studies have shown the efficacy of iron supplementation in treating anemia and its impact on improving symptoms such as fatigue, weakness, and cognitive function.
Investigations into hemochromatosis, a genetic condition leading to iron overload, have provided insights into the consequences of excess iron in the body and the need for regular monitoring and treatment.
In sports medicine, research has examined the link between iron status and athletic performance. Findings have shown that iron deficiency can impair endurance and physical performance in athletes.
The evidence-based guidelines for managing iron-related conditions, such as iron deficiency anemia or hemochromatosis, provide healthcare practitioners with a framework for diagnosis, treatment, and monitoring based on research and clinical trials.
References
- Department of Health & Human Services. (n.d.). Iron and iron deficiency. Better Health Channel. https://www.betterhealth.vic.gov.au/health/conditionsandtreatments/iron
- Du Cancer, C. C. S. /. S. C. (n.d.). Low red blood cell count (anemia). Canadian Cancer Society. https://cancer.ca/en/treatments/side-effects/low-red-blood-cell-count
- Fletcher, J. (2018, June 9). Serum iron test: High, low, and normal ranges. https://www.medicalnewstoday.com/articles/322083
- Gerber, G. F. (2023, October 16). Iron deficiency anemia. MSD Manual Professional Edition. https://www.msdmanuals.com/professional/hematology-and-oncology/anemias-caused-by-deficient-erythropoiesis/iron-deficiency-anemia
- Louisebalmforth. (2023, August 23). What is the difference between ferritin and iron? - Forth With Life. Forth. https://www.forthwithlife.co.uk/blog/whats-the-difference-between-ferritin-and-iron/
- Ministry of Health. (2023, September 14). Iron Deficiency – Diagnosis and Management - Province of British Columbia. https://www2.gov.bc.ca/gov/content/health/practitioner-professional-resources/bc-guidelines/iron-deficiency
- NHS inform. (2023, March 10). Iron deficiency anaemia - Illnesses & conditions | NHS inform. NHS Inform. https://www.nhsinform.scot/illnesses-and-conditions/nutritional/iron-deficiency-anaemia/
- Renee A. Bellanger, PharmD, BCNSP Assistant Professor, Pharmacy Practice University of the Incarnate Word Feik School of Pharmacy San Antonio, Texas. (2010, September 20). Iron Deficiency Anemia in Women. US Pharmacist. https://www.uspharmacist.com/article/iron-deficiency-anemia-in-women
- Thedoc, Thedoc, & Thedoc. (2023, June 8). Healthy Iron Levels For Women. Dr Wholeness -. https://drwholeness.com/blog/healthy-iron-levels-for-women/
- WA Iron Centre. (2020, April 17). Understanding blood test results - WA Iron Centre. https://waironcentre.com.au/understanding-blood-test-results/
Commonly asked questions
Healthcare providers, physicians, hematologists, and individuals concerned about their iron levels often request an Iron Levels Chart for Adults.
It's used during routine check-ups, to diagnose anemia, monitor chronic illnesses, assess fatigue, manage iron disorders, and in pre-operative assessments.
The chart helps interpret iron-related blood test results, track changes over time, and guide healthcare decisions based on established reference ranges.
Filling out the chart is quick, but interpreting results and taking action depends on individual circumstances and medical consultations.
Related Templates

Popular Templates