What Is a Glucose Reading Chart?

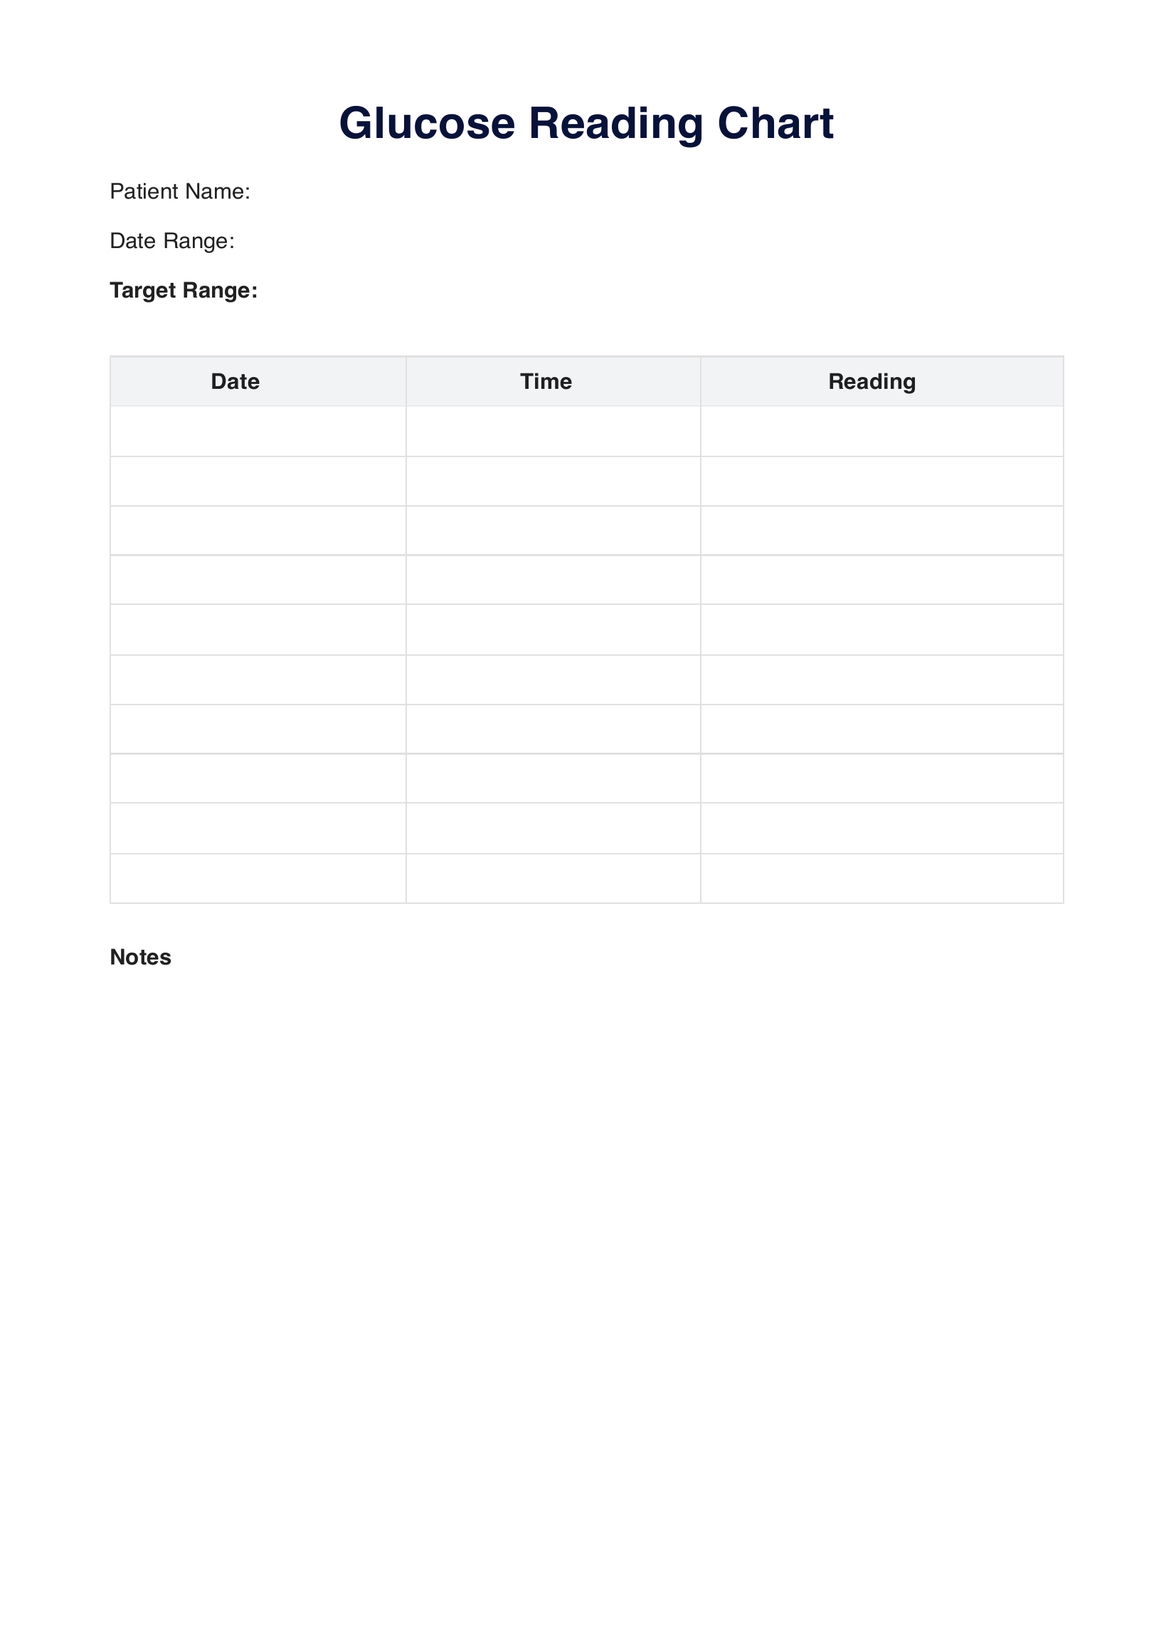
A glucose reading chart, or blood glucose chart, is vital for diabetic people and healthcare professionals. It displays organized data, often as a graph or table, showing blood glucose levels at different times throughout the day.

These charts are crucial for managing diabetes effectively, allowing individuals to gain insights into their blood sugar patterns and trends. Here's a breakdown of what a typical glucose reading chart contains:

  • Time and Date: The chart includes timestamps to indicate when blood glucose measurements were taken. This information helps identify how glucose levels fluctuate throughout the day and night.
  • Blood Glucose Values: The main component of the chart is the blood glucose measurements, often presented in milligrams per deciliter (mg/dL) or millimoles per liter (mmol/L), depending on the region. These values are plotted against the corresponding time points.
  • Target Range: Many glucose reading charts incorporate a target range or a recommended blood glucose level. This range serves as a reference point, and individuals aim to keep their readings within this range to maintain good diabetes control.
  • Medication and Food Intake: Some charts also allow for the documentation of medication or insulin doses and meals/snacks consumed, helping to identify potential causes of blood sugar fluctuations.
  • Notes: Space for notes is often provided on the chart, allowing users to record additional details such as exercise, stress, illness, or other factors that may impact blood glucose levels.
  • Trends and Patterns: By tracking glucose readings over an extended period, users and healthcare providers can identify trends and patterns, helping to adjust treatment plans or lifestyle choices as needed.

Glucose reading charts are essential for diabetes management. They empower individuals to make informed diet, medication, and lifestyle choices. Sharing these charts with healthcare professionals helps optimize treatment and lowers the risk of diabetes complications.

How Does It Work?

Using a Printable Glucose Reading Chart is a straightforward process that can help individuals manage their diabetes by tracking and monitoring their blood glucose levels. Below are the steps involved in using and filling out such a chart:

1. Download a Chart

To begin, you can search for a printable glucose reading chart online. Many websites offer templates that you can download and print for free.

2. Fill in Personal Information

Start by filling in your details at the top of the chart. This may include your name, date, and any other pertinent information.

3. Time and Date

As you take blood glucose measurements, record the time and date of each reading. This helps you identify trends and patterns.

4. Blood Glucose Measurements

Use your glucometer to measure your blood glucose levels per your healthcare provider's recommendations. Note these readings in the designated spaces on the chart.

5. Target Range

Most charts have a target range for blood glucose levels. Ensure your readings fall within this range to maintain optimal control.

6. Medication and Food

Document any medications or insulin doses and the meals or snacks you consume. This helps pinpoint the effects of medicines and diet on your blood sugar.

7. Additional Notes

Use the provided space for notes to record unusual circumstances, such as exercise, stress, or illness, which may impact your blood sugar.

8. Tracking Trends

Over time, observe the trends and patterns in your blood glucose readings. This can be crucial for adjusting your treatment plan and making lifestyle changes.

9. Share with Healthcare Professionals

During medical appointments, share your completed chart with your healthcare provider. They can analyze the data to optimize your treatment plan and reduce the risk of diabetes-related complications.

When Would You Use This Chart?

A Glucose Reading Chart is an invaluable resource for individuals, primarily those dealing with diabetes or healthcare professionals involved in their care. Here's when and how this chart is appropriately used:

  • Daily Monitoring: People with diabetes use the chart to monitor their blood glucose levels daily, ensuring they stay within their target range.
  • Treatment Adjustments: It's crucial for anyone who needs to adjust their treatment plan, such as insulin dosage or dietary choices.
  • Trend Analysis: Regular use helps identify trends, allowing individuals to adapt their lifestyle to achieve better blood sugar control.
  • Communication with Healthcare Providers: When they have medical appointments, sharing the chart with their healthcare provider provides essential data for optimizing treatment.
  • Diagnosis and Initial Assessment: Physicians and endocrinologists use glucose reading charts when diagnosing diabetes and assessing the patient's condition.
  • Treatment Planning: They use these charts to design and adjust treatment plans, including medications, insulin therapy, and dietary recommendations.
  • Monitoring Progress: Healthcare professionals, including diabetes educators and nurses, use these charts to track patients' progress and make necessary changes to ensure optimal blood sugar control.
  • Patient Education: These charts can be valuable educational tools, helping healthcare providers explain the importance of consistent monitoring to their patients.
  • Clinical Studies: Researchers may use aggregated glucose reading charts to analyze trends and patterns in a larger population for diabetes-related studies.
  • Quality Assurance: Hospitals and clinics can employ these charts to maintain quality assurance by ensuring healthcare providers effectively manage their diabetic patients.
  • Insurance Claims and Legal Purposes: In some cases, individuals may need to maintain these charts for insurance claims or legal documentation.

What do the Results Mean?

Interpreting Glucose Reading Chart results is vital for those with diabetes and healthcare providers. These results offer insights into blood sugar control, guiding treatment adjustments. Here's what typical results mean:

Within Target Range (euglycemia)

  • Blood glucose readings within the specified target range (usually between 70-130 mg/dL or 4-7.2 mmol/L) indicate good blood sugar control.
  • This is the goal for most individuals with diabetes. It suggests that their treatment plan, including medication, diet, and lifestyle, effectively manages their condition.

Below Target Range (hypoglycemia)

  • Blood glucose levels below the target range can indicate hypoglycemia when blood sugar drops dangerously low (typically below 70 mg/dL or 4 mmol/L).
  • This condition requires immediate attention, usually with the intake of fast-acting carbohydrates to raise blood sugar to a safe level. Frequent hypoglycemic episodes may necessitate treatment adjustments to prevent them.

Above Target Range (hyperglycemia)

Elevated blood sugar levels, signaling hyperglycemia (often above 180 mg/dL or 10 mmol/L), can lead to diabetes complications. This necessitates lifestyle changes, medication adjustments, or insulin use to return blood sugar to the target range.

Consistent Fluctuations

  • Repeated fluctuations between hypoglycemia and hyperglycemia may indicate a lack of blood sugar stability.
  • Such patterns highlight the need for a comprehensive review of the treatment plan, including insulin doses, dietary choices, and timing of medications.

Consistent High Readings (persistent hyperglycemia)

  • If blood glucose levels are persistently high, it suggests that the current treatment plan is not effectively controlling diabetes.
  • Healthcare professionals may need to adjust medication doses, consider alternative medications, or provide additional education on diabetes management.

Consistent Low Readings (persistent hypoglycemia)

  • Prolonged low blood sugar readings may indicate the individual is at risk for frequent hypoglycemic episodes.
  • Treatment adjustments are necessary to prevent further hypoglycemia and its associated risks.

Research & Evidence

The history of diabetes management dates back to ancient civilizations, with rudimentary methods for diagnosing and monitoring the condition. The early 20th century saw the development of fundamental methods for blood glucose testing, which became more sophisticated over time.

As glucose monitoring technology advanced, the need for a systematic method to record and analyze blood sugar readings became apparent. The first glucose reading charts were paper-based and designed for individuals to record their blood glucose measurements and relevant details manually.

Electronic glucose reading charts and smartphone apps have become prevalent with the digital revolution, allowing for more efficient and automated data collection.

The Diabetes Control and Complications Trial (DCCT), a groundbreaking study in the late 1980s, provided substantial evidence regarding the benefits of tight glucose control. It emphasized the importance of frequent monitoring, which relied on glucose reading charts.

Studies have established specific target ranges for blood glucose levels. The American Diabetes Association and other international organizations provide guidelines based on extensive research and clinical trials.

Research consistently shows that maintaining blood glucose within target ranges can reduce the risk of diabetes-related complications, including cardiovascular problems, kidney disease, and vision issues.

Evidence suggests that individuals who actively monitor and use glucose reading charts are better equipped to understand and manage their condition, improving their quality of life.

References

Who typically requests a Glucose Reading Chart?

Commonly asked questions

Who typically requests a Glucose Reading Chart?

Individuals with diabetes and healthcare professionals typically request Glucose Reading Charts.
When are Glucose Reading Charts used?

Glucose Reading Charts are used daily by individuals with diabetes to monitor blood sugar levels. They are also used during healthcare appointments to assess diabetes management.

How are Glucose Reading Charts used?

Users record their blood glucose readings at specific times and note other relevant details on the chart, such as meals and medications. This data is then analyzed to adjust treatment plans and control blood sugar.

Join 10,000+ teams using Carepatron to be more productive

One app for all your healthcare work