BBT Pregnancy Chart
Track your pregnancy journey with our free BBT Pregnancy Chart. Monitor basal body temperature and fertility.

Fact Checked by Ericka Pingol.


What is a BBT Pregnancy Chart?
A BBT (Basal Body Temperature) pregnancy chart is a valuable tool for individuals who are actively trying to conceive. It involves the daily recording of one's basal body temperature, typically measured first thing in the morning before any activity. The chart serves as a visual representation of a woman's menstrual cycle, helping to identify patterns and changes in temperature that can signal ovulation and potential pregnancy.
The use of BBT to track ovulation was first proposed in the 1930s by Austrian physician Dr. Hermann Knaus. He observed that women's body temperatures tended to drop slightly just before ovulation and rise steadily afterward. This pattern, known as a biphasic pattern, is due to the surge of progesterone after ovulation.
In the 1950s, a Belgian gynecologist, Dr. Marcel Moru refined the method by emphasizing the importance of taking BBT first thing in the morning, before any activity or movement. He also developed a charting system to track BBT fluctuations.
BBT pregnancy charts are a simple and relatively inexpensive way to track ovulation and potential pregnancy. They can be helpful for women who are trying to conceive, as they can identify the most fertile days of the menstrual cycle. BBT charts can also monitor overall menstrual health and detect potential hormone imbalances.
However, it is essential to note that a BBT pregnancy chart template is not a foolproof method of detecting ovulation or pregnancy. Other factors, such as illness, sleep disturbances, and certain medications, can affect BBT readings. If you are concerned about your fertility or your ability to conceive, it is always best to consult with a healthcare professional.
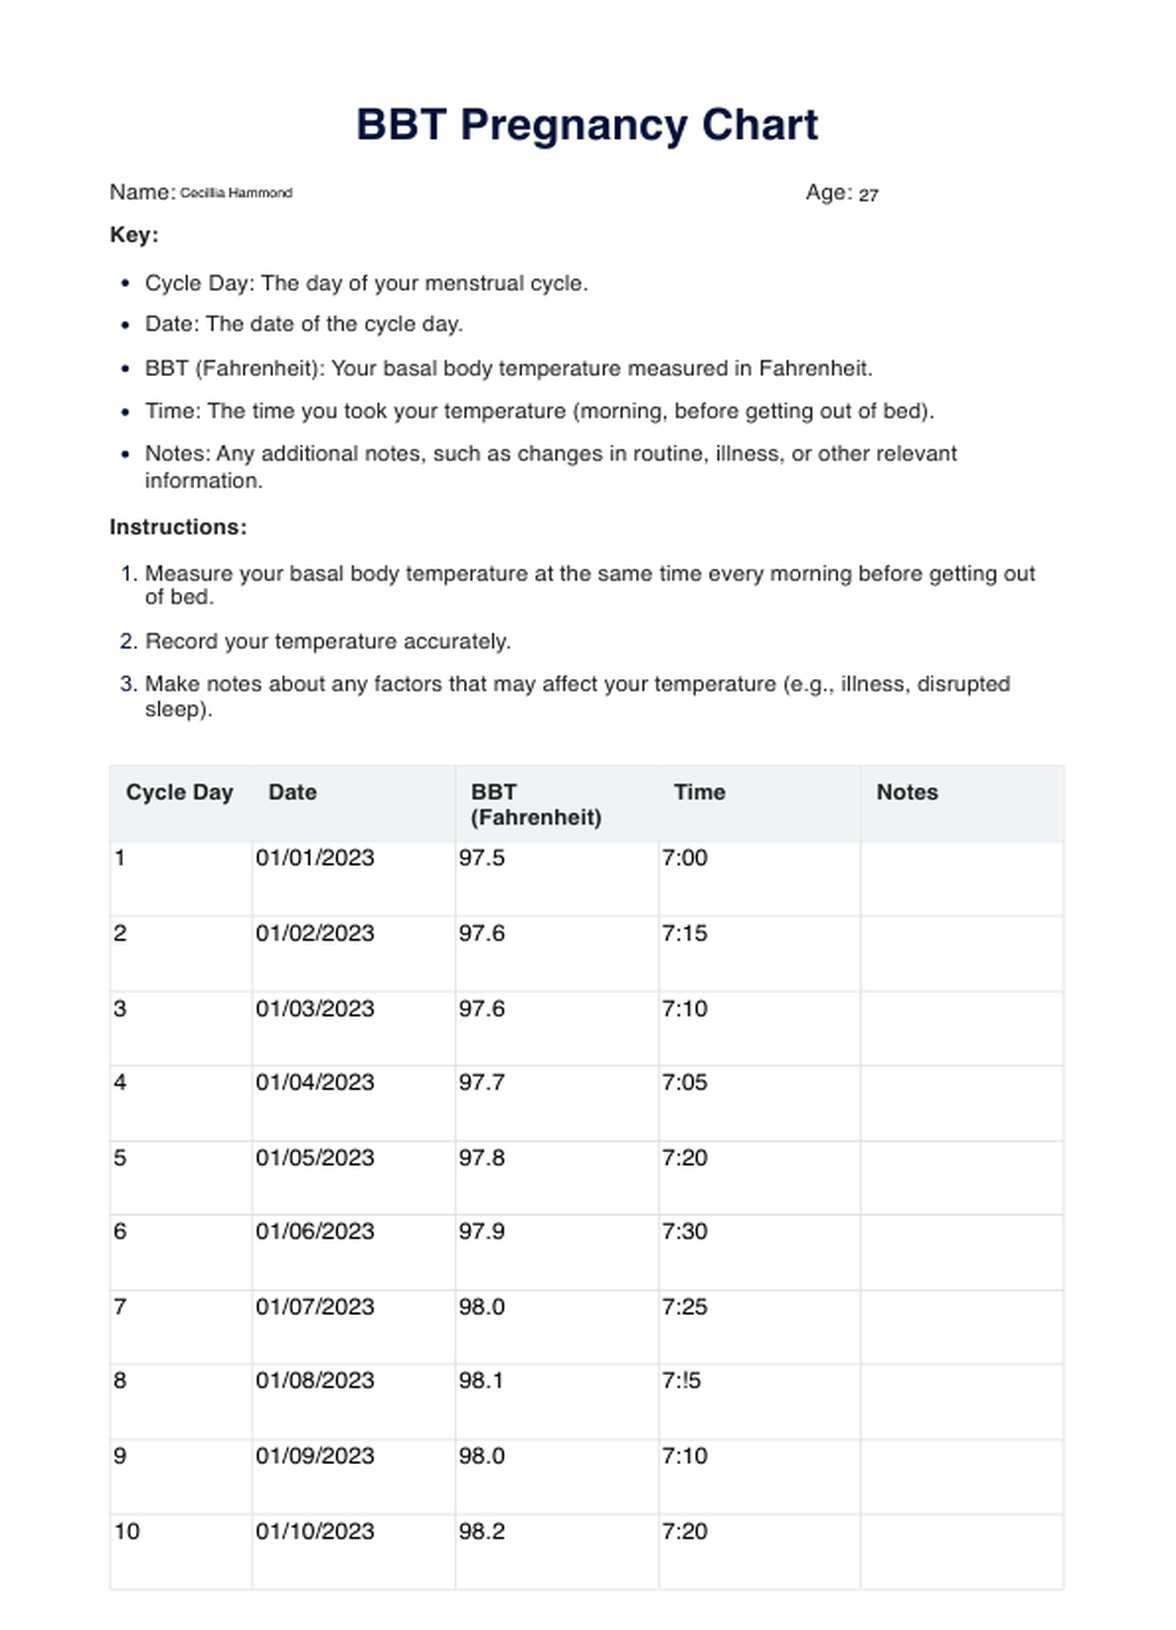
BBT Pregnancy Chart Template
BBT Pregnancy Chart Example
How does it work?
Creating and maintaining a BBT pregnancy chart involves a straightforward yet meticulous process. The goal is to observe and record subtle changes in basal body temperature to gain insights into the menstrual cycle and fertility. Below are the essential steps to guide you in developing your own BBT pregnancy chart:
1. Purchase a basal thermometer
Invest in a basal thermometer specifically designed to measure the slightest temperature changes accurately. Unlike regular thermometers, basal thermometers provide more precision for tracking subtle fluctuations in body temperature.
2. Establish consistent measurement time
Choose a specific time each morning to measure your basal body temperature, preferably before any physical activity or getting out of bed. Consistency in the measurement time is crucial for accurate charting.
3. Record temperatures daily
Keep a dedicated BBT chart or use a fertility tracking app to log your daily temperature readings. Plot each day's temperature on the chart, with the horizontal axis representing the days of your menstrual cycle and the vertical axis displaying the corresponding temperatures.
4. Identify temperature shift
Pay attention to changes in your BBT, significantly the slight increase after ovulation. This temperature shift is indicative of the release of an egg and the beginning of the luteal phase, typically signaling the most fertile period.
5. Analyze patterns
Over time, observe patterns in your BBT chart. A consistent temperature rise after ovulation followed by a sustained high temperature may indicate a successful conception.
For an easy start, consider utilizing Carepatron's printable BBT pregnancy chart. Carepatron provides a user-friendly template that simplifies the charting process, making it a valuable resource for those embarking on their fertility journey.
When would you use this Template?
Carepatron's BBT pregnancy chart template is a versatile resource that can prove invaluable for various scenarios and individuals on their reproductive health journey. Here are vital instances when utilizing this template becomes particularly advantageous:
1. Family planning
Whether you're actively trying to conceive or planning for future family expansion, the BBT pregnancy chart template is essential. It systematically tracks ovulation cycles, helping you identify the most fertile days and optimizing your chances of successful conception.
2. Fertility awareness
This template is a reliable companion for individuals practicing fertility awareness methods or natural family planning. By consistently recording basal body temperatures, you can enhance your understanding of your menstrual cycle, making informed decisions about when to avoid or actively pursue pregnancy.
3. Healthcare consultations
When seeking guidance from healthcare professionals, presenting a well-documented BBT pregnancy chart can significantly aid discussions. The template streamlines the process, allowing practitioners to quickly interpret the data and offer personalized advice based on your unique reproductive patterns.
4. Identifying irregularities
The BBT pregnancy chart template is instrumental in detecting irregularities or potential issues with your menstrual cycle. If you experience challenges in conception or suspect fertility concerns, this resource provides a structured means to highlight patterns that may require further investigation.
5. Collaborative approach
Couples navigating fertility together can benefit from using the BBT pregnancy chart template collaboratively. It encourages shared involvement in the family planning process, fostering communication and understanding between partners.
Carepatron's BBT pregnancy chart template is a user-friendly and comprehensive tool that simplifies the tracking process and enhances the overall fertility awareness experience. Whether you manage your reproductive health independently or consult with healthcare professionals, this template is tailored to meet your needs effectively.
What do the results mean?
Understanding the results of your BBT pregnancy chart is pivotal for informed family planning. Here, we break down expected outcomes and their significance:
1. Consistent temperature tise (post-ovulation)
A sustained increase in basal body temperature following ovulation is a positive sign. It suggests that an egg has been released and the body has entered the luteal phase. This temperature rise typically endures until menstruation, signaling a healthy hormonal balance.
2. Biphasic pattern
A biphasic pattern, with two distinct temperature phases in your BBT chart, indicates a regular and healthy menstrual cycle. The first phase represents the follicular phase, and the second phase denotes the luteal phase. This consistency is a positive sign for fertility.
3. Triphasic pattern
An occasional third temperature shift in the luteal phase, known as a triphasic pattern, might occur. While absent, it can suggest possible implantation and early pregnancy. However, not all women experience this, and its absence doesn't necessarily indicate infertility.
4. Erratic temperatures
This means that irregular and erratic temperatures in your BBT chart may signify hormonal imbalances or irregular ovulation. Consult with a healthcare professional if this pattern persists, as it could impact fertility or indicate an underlying health concern.
5. Lack of temperature rise
If your BBT chart shows no discernible temperature rise post-ovulation, it might suggest anovulation or an issue with the luteal phase. Tracking this pattern over several cycles could help identify fertility challenges that require further investigation.
Interpreting your BBT pregnancy chart is a valuable skill in the realm of fertility awareness.
Research & evidence
Basal body temperature (BBT) charting is a fertility tracking method that involves monitoring a woman's basal body temperature, which is her lowest body temperature after rest. BBT charts can identify ovulation, predict upcoming periods, and potentially detect early pregnancy (Duane, M., Stanford, J.B., Porucznik, C.A., Vigil, P., 2022).
Using BBT to track fertility dates back to the early 20th century. In 1929, Austrian physician Dr. Paul Döring published a paper describing how he had used BBT to confirm ovulation in women (Steward, K., Raja, A., 2022). Döring's work laid the foundation for developing BBT charting as a fertility awareness method.
In the 1930s, American gynecologist Dr. Martha Voigt continued to explore the use of BBT charting. Voigt developed a standardized method for tracking BBT and promoted its use as a natural family planning method.
BBT charting gained popularity in the 1960s and 1970s with the development of fertility monitors, making it easier to track BBT. Today, BBT charting is still a popular fertility tracking method, and many online resources and apps can help women chart their BBT (Newill, R. G., Katz, M., 1982).
BBT charts can be a valuable tool for women who are trying to conceive or who want to avoid pregnancy. By identifying ovulation, women can time intercourse to increase their chances of getting pregnant. BBT charts can also help women predict their upcoming periods, which can be helpful for women who have irregular cycles.
In addition, BBT charts may be able to detect early pregnancy. After ovulation, progesterone levels rise and cause a slight increase in BBT. If a woman's BBT remains elevated for 18 days or more, it may be a sign of early pregnancy. However, it is essential to note that BBT charting is not a definitive way to detect pregnancy, and a pregnancy test should always be used to confirm.
References
Duane, M., Stanford, J.B., Porucznik, C.A., Vigil, P. (2022). Fertility awareness-based methods for women’s health and family planning. https://www.ncbi.nlm.nih.gov/pmc/articles/PMC9171018/
Steward, K., Raja, A. (2022) Physiology, ovulation, and basal body temperature. https://www.ncbi.nlm.nih.gov/books/NBK546686/
Newill, R.G., Katz, M. (1982). The basal body temperature chart in artificial insemination by donor pregnancy cycles. https://pubmed.ncbi.nlm.nih.gov/7117570/
Commonly asked questions
To create a BBT pregnancy chart template, download a user-friendly template like the one provided by Carepatron. Input your daily basal body temperatures, ensuring consistency in measurement time, and observe patterns to gain insights into your menstrual cycle and fertility.
BBT pregnancy chart templates are used by individuals actively trying to conceive, those practicing fertility awareness methods, or anyone interested in gaining insights into their reproductive health. It offers a systematic approach to tracking ovulation cycles and optimizes family planning efforts.
BBT pregnancy chart templates record daily basal body temperatures, typically measured in the morning before any activity. The recorded temperatures are then plotted on the template, creating a visual representation of the menstrual cycle. This helps identify patterns, especially the temperature rise after ovulation, which is crucial for pinpointing fertile days.
Related Templates

Popular Templates