What is an ANA Levels Chart?

An ANA (Antinuclear Antibody) Levels Chart is a medical resource that provides a graphical representation of the levels of antinuclear antibodies in a patient's blood. Antinuclear antibodies are proteins produced by the immune system that mistakenly target and attack the body's cells and tissues, particularly the nucleus of cells. The presence and quantity of these antibodies are often measured through blood tests, and the results are typically reported as titers.

This chart serves as a visual aid for healthcare professionals to interpret and understand the results of these tests. The chart typically displays different levels or titers of ANA, ranging from low to high, and may include specific antibody patterns associated with various autoimmune diseases. 

Autoimmune diseases are conditions in which the immune system attacks healthy cells. ANA testing is commonly used to diagnose and monitor these disorders, such as lupus, rheumatoid arthritis, and Sjögren's syndrome.

The chart assists healthcare providers in assessing the severity of the immune system's response and aids in the identification of specific autoimmune conditions based on the pattern of antibodies present. Interpreting ANA levels is crucial for determining the appropriate treatment and management strategies for patients with autoimmune diseases.

Patients and their caregivers can also benefit from the ANA Levels Chart as it visually represents the immune system's activity, fostering better understanding and communication between healthcare professionals and those affected by autoimmune conditions. 

The ANA Levels Chart is a valuable tool in diagnosing, monitoring, and managing autoimmune diseases, contributing to more informed decision-making in rheumatology and immunology.

How Does It Work?

Understanding and utilizing a Printable ANA Levels Chart involves steps from accessing the form to interpreting results. Here's a breakdown of the process:

1. Accessing the Form

Locate a printable ANA Levels Chart, often provided by healthcare institutions or available online. Ensure that the chart is up-to-date and aligns with current medical standards.

2. Patient Information

Fill in essential patient details, including name, date of birth, and relevant identification information. Provide information about the date and time of the blood draw.

3. Recording ANA Levels

Enter the ANA titers from the blood test results in the designated spaces. Titers are typically expressed as ratios (e.g., 1:80), indicating the dilution at which ANA remains detectable.

4. Visual Patterns

Some charts may include visual representations of different ANA patterns, such as speckled, homogeneous, or nucleolar. Cross-reference the obtained patterns from the test with those on the chart to identify potential autoimmune associations.

5. Reference Ranges

Ensure the chart includes reference ranges or cutoff values for normal and abnormal ANA levels. Interpret results in the context of these reference ranges to determine the significance of the antibody levels.

6. Clinical Correlation

Consider the patient's symptoms, medical history, and other diagnostic tests. Correlate the ANA levels and patterns with clinical findings to guide further investigation or diagnosis.

7. Healthcare Professional Consultation

Share the completed chart with a healthcare professional for a comprehensive evaluation. Collaborate with the healthcare team to understand the implications of the results and discuss potential treatment options.

8. Follow-Up

If necessary, schedule follow-up appointments and additional ANA tests to monitor changes over time. Adjust treatment plans based on evolving clinical assessments.

When Would You Use This Chart?

The ANA Levels Chart is a valuable resource primarily utilized by healthcare practitioners, especially in rheumatology, immunology, and internal medicine. Here are scenarios when this chart proves to be particularly beneficial:

  • Autoimmune Disease Diagnosis: The chart is extensively used when investigating and diagnosing autoimmune diseases. Elevated levels of antinuclear antibodies and specific patterns observed on the chart can provide crucial insights into conditions such as lupus, rheumatoid arthritis, and scleroderma.
  • Monitoring Disease Progression: Practitioners regularly employ the ANA Levels Chart to monitor the progression of autoimmune diseases over time. Periodic testing allows healthcare professionals to assess changes in antibody levels and patterns, helping to refine treatment strategies and adjust medications accordingly.
  • Treatment Efficacy Assessment: The chart becomes useful when managing autoimmune disorders with immunosuppressive therapies. It helps evaluate the effectiveness of treatments by tracking fluctuations in ANA levels and guiding clinicians in making informed decisions regarding medication adjustments.
  • Differentiating Autoimmune Conditions: The chart assists in distinguishing between various autoimmune conditions. Different patterns on the chart may be associated with specific diseases, aiding practitioners in narrowing down potential diagnoses and formulating targeted treatment plans.
  • Educational Purposes: The chart is valuable for educating healthcare professionals and patients. It serves as a visual aid that enhances understanding of autoimmune diseases, ANA testing, and the significance of specific antibody patterns.
  • Research and Clinical Studies: Researchers in immunology and rheumatology may use aggregated ANA Levels Charts in clinical studies. This can contribute to a broader understanding of the prevalence and patterns of antinuclear antibodies in specific populations.
  • Preventive Medicine: In some cases, practitioners may use ANA testing and the chart as part of preventive medicine. This is particularly relevant when assessing individuals with a family history of autoimmune diseases or those exhibiting early symptoms.

What Do the Results Mean?

Interpreting the results of an ANA test, often accompanied by a free ANA Levels Chart, requires a nuanced understanding of the various patterns and titers. Here's an overview of expected results and their potential implications:

  • Negative Results: A negative result generally means that no antinuclear antibodies were detected in the blood during the test. This is considered normal and suggests the absence of autoimmune activity.
  • Low Titers (1:40 to 1:80): Low titers may be within the normal range, and many healthy individuals may have low-level ANA without any autoimmune disease. Considering the overall clinical picture and symptoms in such cases is crucial.
  • Moderate Titers (1:160 to 1:320): Moderate titers may indicate a potential autoimmune response. Healthcare professionals will assess the patient's symptoms, medical history, and other diagnostic factors to determine if further investigation or monitoring is necessary.
  • High Titers (1:640 and above): High titers are more suggestive of autoimmune activity and may warrant closer attention. However, a high titer alone does not diagnose a specific autoimmune disease. Clinical correlation and additional tests are essential for a comprehensive evaluation.
  • Distinct Patterns on the Chart: The ANA Levels Chart often includes visual representations of antibody patterns, such as speckled, homogeneous, nucleolar, or centromere patterns. These patterns can provide clues about potential autoimmune conditions.
  • Homogeneous Pattern: Often associated with systemic lupus erythematosus (SLE) but can be found in other autoimmune conditions.
  • Speckled Pattern: Commonly seen in lupus and Sjögren's syndrome but may also be present in other autoimmune disorders.
  • Nucleolar Pattern: Associated with scleroderma and other connective tissue diseases.
  • Centromere Pattern: Found in conditions like systemic sclerosis (scleroderma) and limited cutaneous systemic sclerosis.

Research & Evidence

The historical exploration of autoimmune diseases through ANA testing and ANA level charts dates back to the mid-20th century, with the presence of antinuclear antibodies in the sera of patients being first recognized (Irure‐Ventura & López-Hoyos, 2022).

The development of techniques like indirect immunofluorescence (IIF) and enzyme-linked immunosorbent assay (ELISA) played a pivotal role in refining ANA testing methodologies (Al-Zougbi).

Extensive research over the years has sought to understand the significance of antinuclear antibodies in autoimmune diseases (Cınar et al., 2019). Early studies focused on linking specific antibody patterns to distinct autoimmune conditions, laying the foundation for the diagnostic utility of ANA testing.

Numerous clinical trials and observational studies have facilitated the establishment of ANA testing as a valuable tool in rheumatology and immunology. This research has explored sensitivity and specificity in different populations, leading to the development of standardized protocols for interpreting ANA test results (Bio-Rad Diagnostics, 2018).

ANA Levels Charts, accompanied by guidelines, have further enhanced the accessibility and comprehensibility of ANA test results (Jones, 2019). These charts assist healthcare professionals in interpreting ANA titers and patterns, providing a visual reference for diagnosis and treatment decisions.

The evidence supporting ANA testing and associated charts is derived from research articles, clinical guidelines, and consensus statements from professional medical organizations (Nosal, 2022).

This collective body of literature acknowledges the utility of ANA testing in diagnosing various autoimmune diseases, and ongoing research continues to refine its role in predicting disease outcomes and guiding treatment strategies.

References

Al-Zougbi, A., MD. (n.d.). Antinuclear Antibody: reference range, interpretation, collection, and panels. https://emedicine.medscape.com/article/2086616-overview?form=fpf

Bio-Rad Diagnostics. (2018, June 15). 4. What to do with a positive ANA IFA Screen [Video]. YouTube. https://www.youtube.com/watch?v=0T6LAd-2M5s

Cınar, O. K., Foley, C., Al‐Hussaini, A., Gilmour, K., Buckland, M., & Obaidi, M. A. (2019). 34 Can high ANA titer and clinical features predict developing autoimmune conditions in children? BMJ ジャーナルhttps://doi.org/10.1136/archdischild-2019-gosh.34

イルール・ベンチュラ、J.、ロペス・オヨス、M.(2022)。抗核抗体 (ANA) の過去、現在、未来 診断12(3), 647。 https://doi.org/10.3390/diagnostics12030647

ジョーンズ、C.(2019年1月17日)。 ANA検査とリウマチ検査。がん治療アドバイザー。 https://www.cancertherapyadvisor.com/home/decision-support-in-medicine/hospital-medicine/ana-and-rheumatologic-tests/

R・S・ノサル(2022年12月29日)。 生化学、抗核抗体 (ANA)。スターパール-NCBI ブックシェルフ https://www.ncbi.nlm.nih.gov/books/NBK537071/

どのANAレベルが高いと見なされますか?

よく寄せられる質問

どのANAレベルが高いと見なされますか?

ANAレベルチャートは通常、医療従事者、特にリウマチ専門医、免疫専門医、内科医からリクエストされます。これらの表は、自己免疫疾患の診断と管理に役立ちます。

ループスを表すANA番号はどれですか?

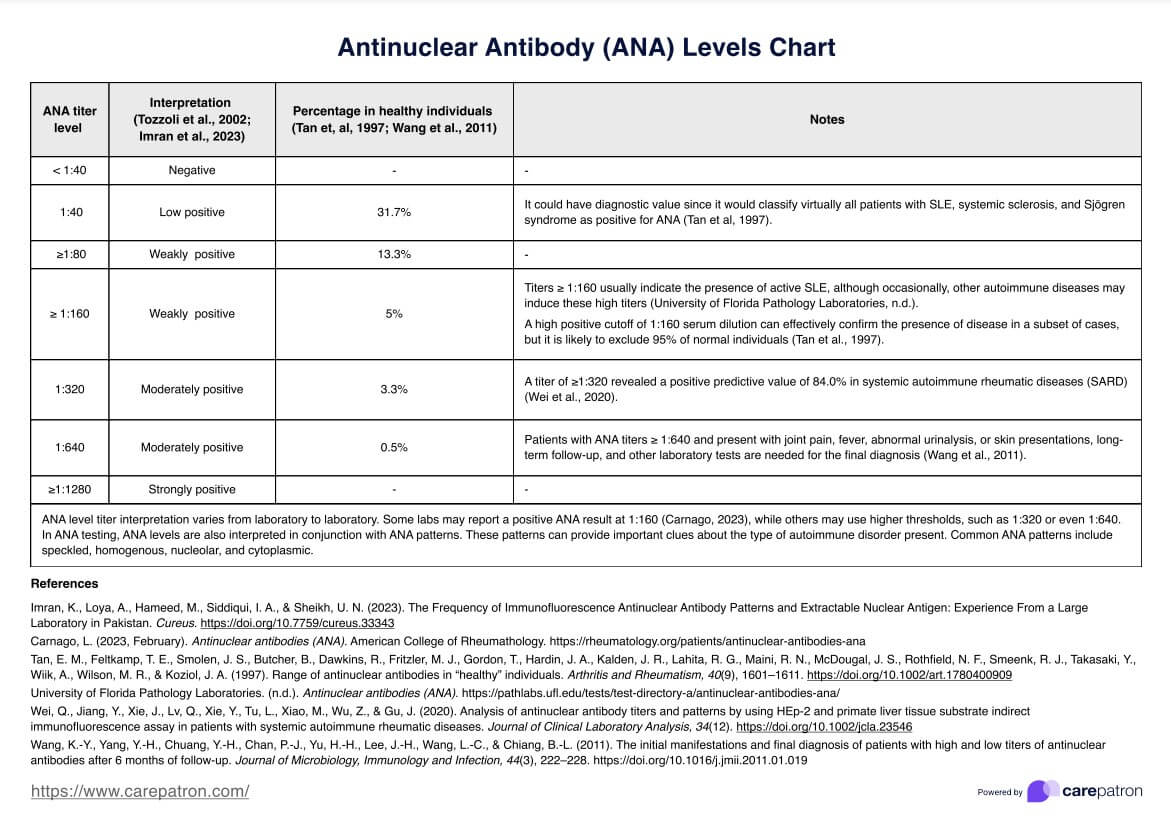
ANAレベルチャートは、自己免疫疾患について患者を評価する際に使用されます。ループス、関節リウマチ、強皮症などの病状の診断、モニタリング、管理において重要な役割を果たします。

ANAレベル表の使い方は?

医療従事者は、ANAレベルチャートを使用してANAテストの結果を解釈します。チャートは抗体のレベルとパターンを視覚的に表すので、特定の自己免疫疾患を特定したり、治療法の決定を導くのに役立ちます。

ANAの結果の正常範囲はどのくらいですか?

ANAレベル表の作成にかかる時間は、使用するソフトウェアやフォーマットによって異なります。通常、患者情報の入力とANAレベルの記録は効率的に行うことができ、チャートは診断プロセス中にすぐに参照できるように設計されています。所要時間は、患者様の症例の複雑さや医療従事者のワークフローによって異なる場合があります。

Carepatronを使用して10,000以上のチームに参加して、生産性を高めましょう

1つのアプリですべての医療業務に対応