High Blood Sugar Levels
Track and manage elevated glucose with the High Blood Sugar Levels Chart. Essential for diabetes care and prevention. Download the chart now.


What is a High Blood Sugar Levels Chart?
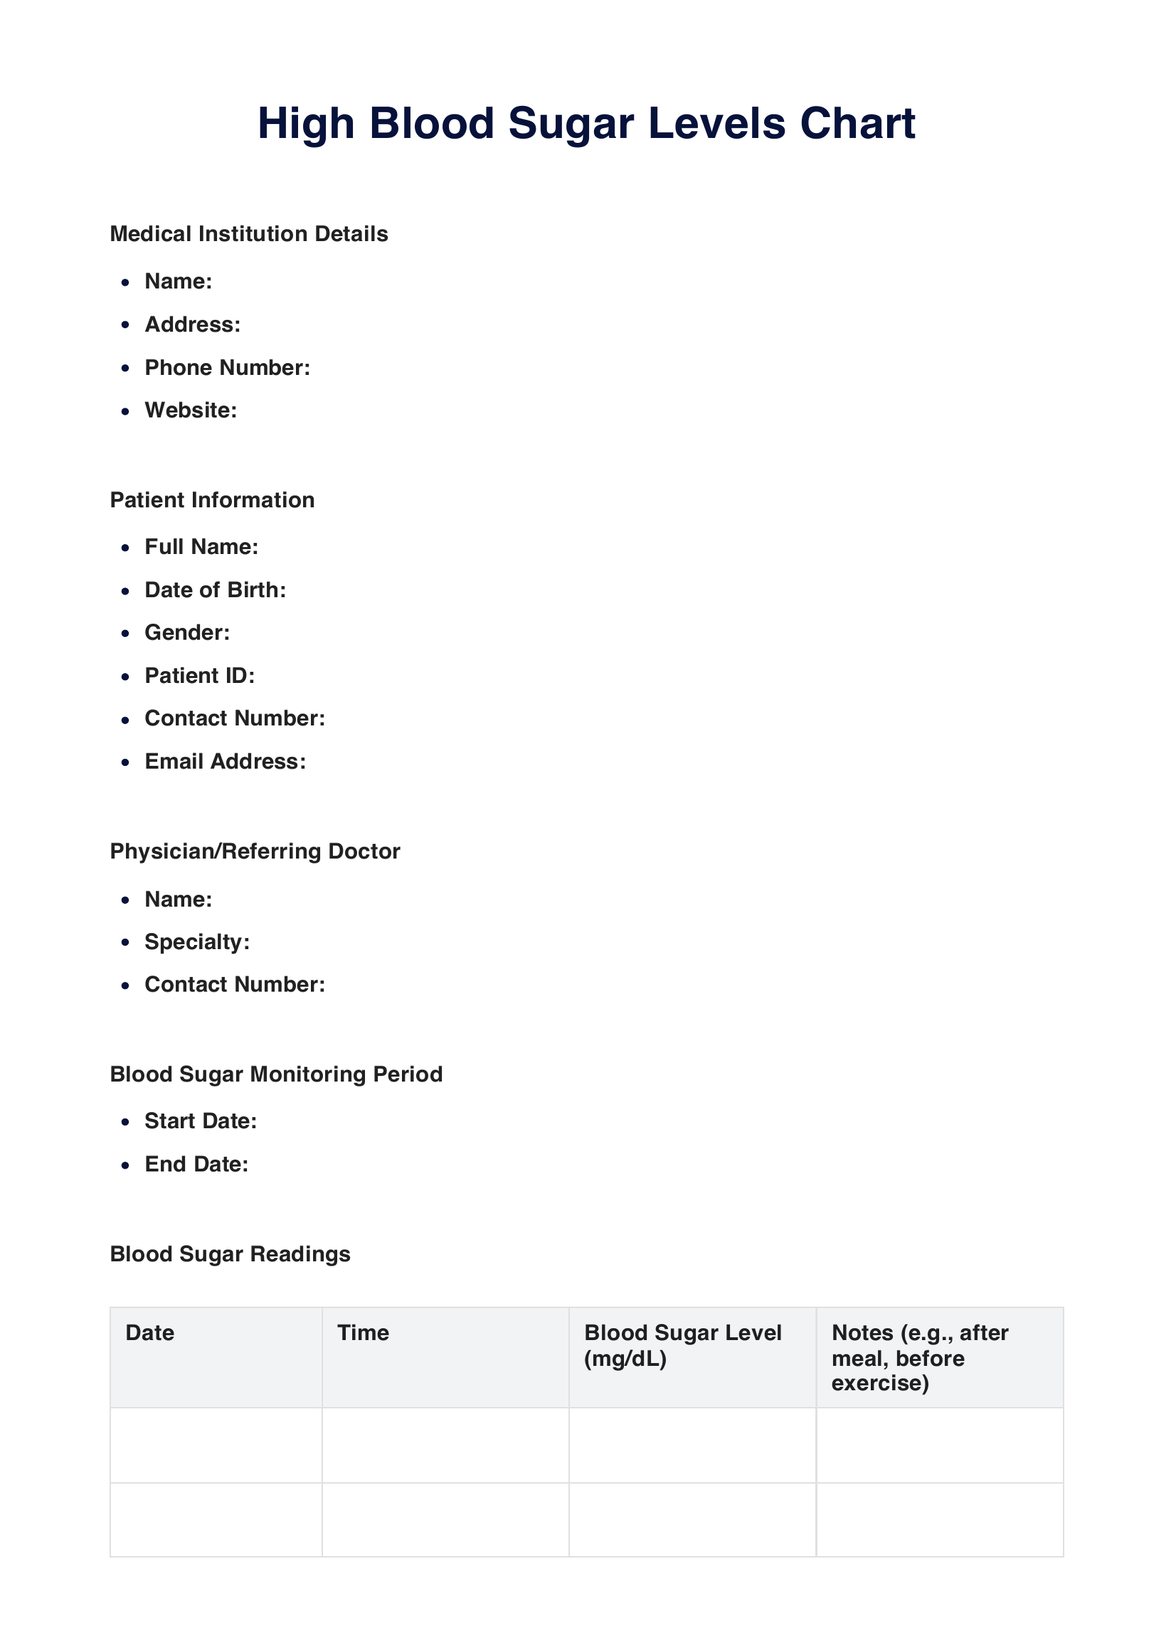
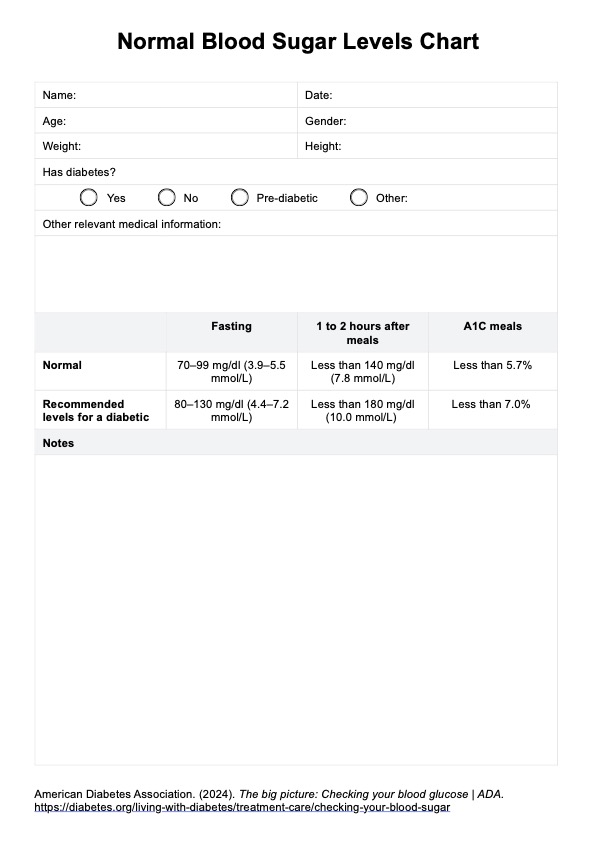
A High Blood Sugar Levels Chart is a comprehensive visual aid for individuals to monitor and comprehend their blood sugar (glucose) levels across various timeframes. Hyperglycemia, or elevated blood sugar levels, poses significant health risks, potentially leading to complications such as diabetes if not addressed promptly. The chart offers several advantages:
- Detailed Visualization: It presents blood sugar readings in an organized manner, making it easier to discern trends and anomalies.
- Pattern Recognition: The chart facilitates the identification of recurring patterns, helping users and healthcare professionals pinpoint periods of stability or fluctuation.
- Highlighting Extremes: It marks extreme spikes or prolonged elevated levels, critical data points for intervention.
- Consistency Tracking: Over time, the chart can reveal whether high blood sugar levels are isolated incidents or a consistent issue.
Utilizing our High Blood Sugar Levels chart, individuals gain a deeper insight into how their lifestyle choices, from diet to exercise and medication, influence their blood sugar levels. This knowledge empowers them to make proactive decisions to manage and even avert diabetes-related complications. The chart proves particularly invaluable for those already diagnosed with diabetes or those who are at a heightened risk of the disease.
High Blood Sugar Levels Template
High Blood Sugar Levels Example
How does it work?
Capturing Blood Sugar Readings
A High Blood Sugar Levels Chart begins with consistently recording blood sugar levels. Using a glucometer, individuals can measure their blood sugar levels at various times throughout the day. It's essential to capture these readings diligently, as the more comprehensive the data set, the more accurate and insightful the analysis will be. This step forms the foundation of the chart, ensuring that users have a detailed record to refer to over extended periods.
Time-Stamping Each Reading
A precise time stamp should accompany every blood sugar measurement. This meticulous documentation allows for a deeper understanding of blood sugar fluctuations concerning daily events. Whether it's the intake of a particular meal, a bout of exercise, or the timing of medication, noting the exact time helps in correlating these events with rises or drops in blood sugar. Over time, this can offer invaluable insights into how different activities or foods impact individual blood sugar levels.
Analyzing and Recognizing Patterns
With a growing set of data on the chart, individuals can begin to identify recurring trends. For instance, they might notice specific times of day when their blood sugar tends to spike or dip. Recognizing these patterns is instrumental in understanding the broader impact of daily routines on glucose management.
Collaborative Review with Healthcare Professionals
Beyond personal analysis, it's highly beneficial to review the chart with a healthcare expert periodically. Their professional insights can help decode complex patterns, and they can offer guidance on potential lifestyle adjustments, medication tweaks, or other interventions. This collaborative approach ensures that individuals are not just collecting data but actively using it to improve their health.
We have a Printable High Blood Sugar Levels Chart available for printing and download.
When would you use this Chart?
The High Blood Sugar Levels Chart is a pivotal tool in health management, particularly in diabetes and its associated conditions. Its applications span across various scenarios:
- Diabetes and Prediabetes Management: For individuals diagnosed with diabetes or prediabetes, this chart becomes an essential daily companion. It aids in tracking blood sugar fluctuations, helping users understand how different factors, such as meals, stress, or physical activity, influence their glucose levels.
- Professional Healthcare Assessment: Healthcare providers, including endocrinologists and general practitioners, utilize these charts to assess the efficacy of prescribed treatment regimens. By reviewing a patient's chart, they can determine if medications are working as intended or if adjustments are necessary.
- Patient Education: The chart serves as a tangible educational tool. Healthcare professionals can use it to illustrate to patients the direct impact of lifestyle choices, such as diet and exercise, on blood sugar levels. This visual aid can be instrumental in motivating patients to adopt healthier habits.
- Research and Clinical Studies: In the ever-evolving field of medical research, especially studies centered on diabetes treatments or interventions, the High Blood Sugar Levels Chart provides invaluable data. Researchers can analyze these charts to gauge the effectiveness of new medications, dietary interventions, or other treatment modalities.
- Risk Assessment: For individuals at risk of developing diabetes due to factors like family history or obesity, the chart can act as an early warning system. Regular monitoring can help in the early detection of elevated blood sugar levels, paving the way for timely interventions.
The High Blood Sugar Levels Chart is not just a tool but a comprehensive resource, facilitating better health outcomes and fostering a deeper understanding of one's body and its responses.
What do the results mean?
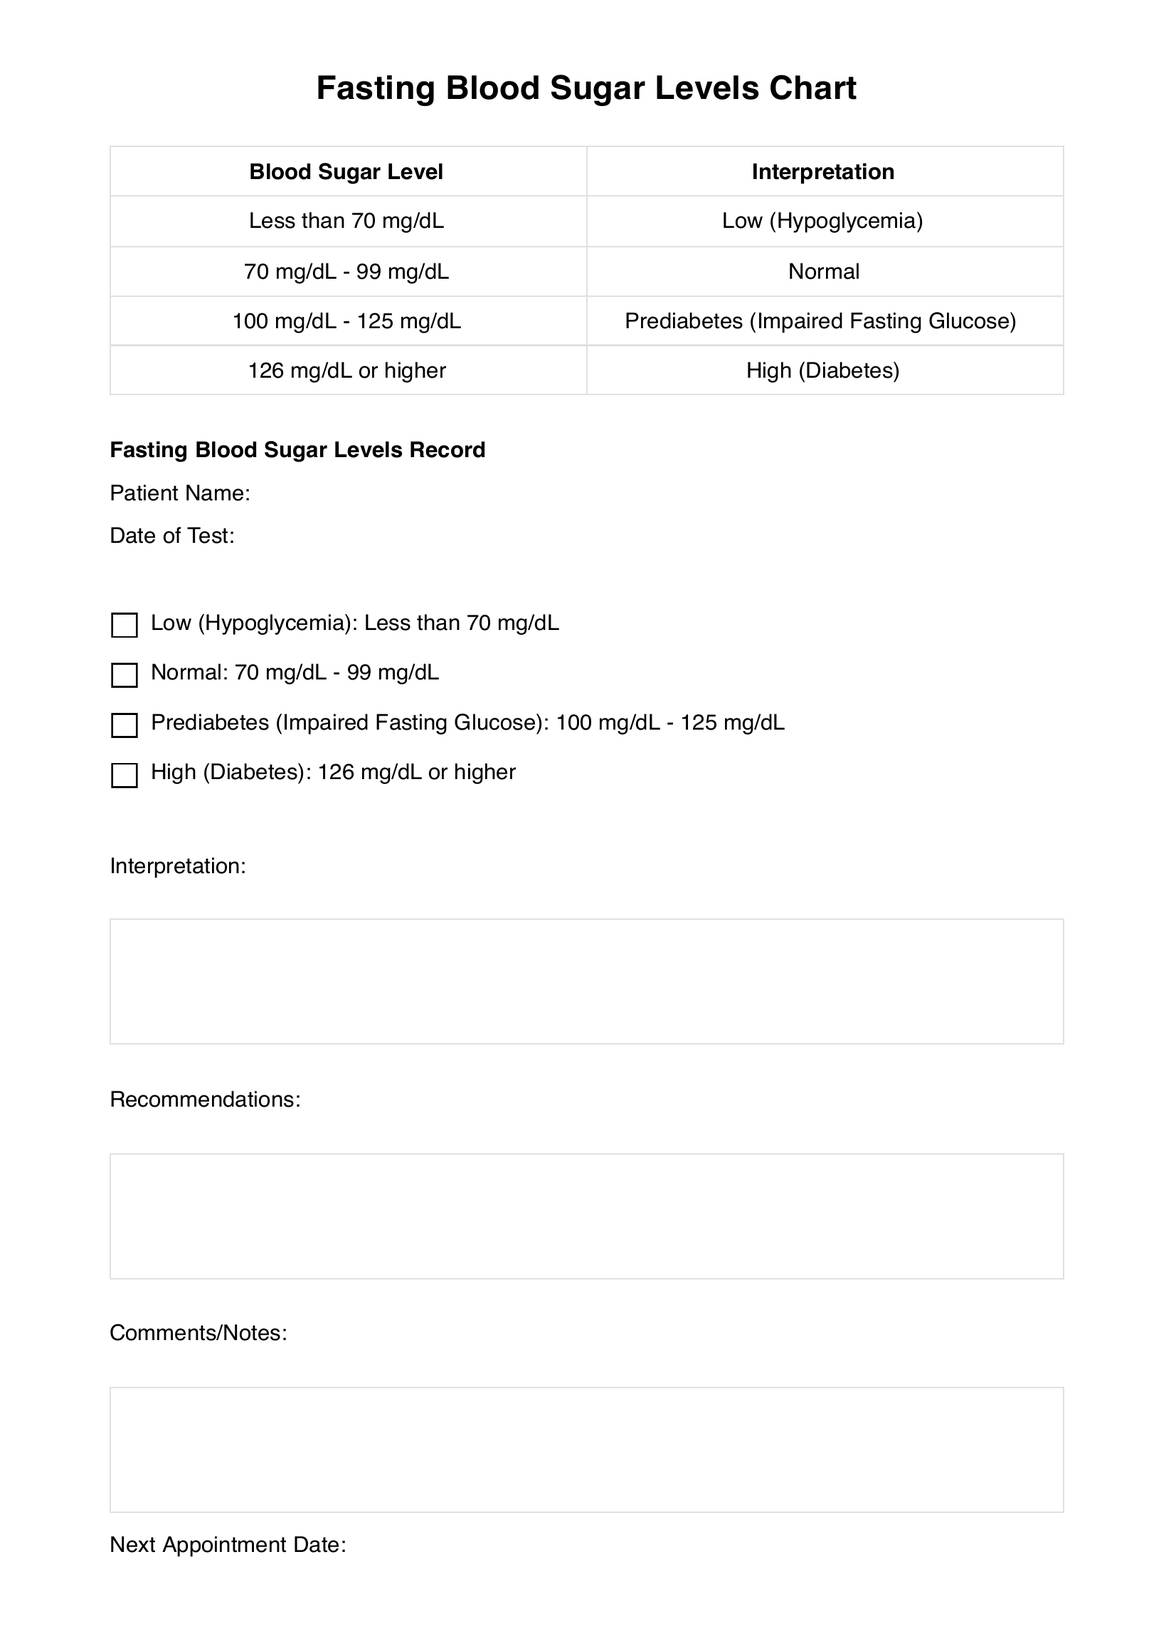
Interpreting the results from a High Blood Sugar Levels Chart is crucial for understanding one's health status, especially concerning glucose management. The readings on the chart offer insights into how well an individual's blood sugar is being managed and can provide early warnings about potential health issues.
- Target Range Readings: Blood sugar readings consistently within the recommended target ranges indicate effective glucose management. Such readings suggest that the individual's diet, exercise regimen, and, if applicable, medication are successfully maintaining blood sugar levels within a healthy range.
- Elevated Readings: Frequent readings above the recommended range signal hyperglycemia or high blood sugar. Persistent hyperglycemia can be a symptom of uncontrolled diabetes and, if left untreated, can lead to severe complications such as nerve damage, kidney disease, cardiovascular issues, and more.
- Impact of Activities: The chart can highlight how specific activities, meals, or medications affect blood sugar levels. For instance, a spike in glucose levels after a carbohydrate-rich meal or a drop after rigorous exercise can be easily visualized.
- Guidance for Intervention: Consistently abnormal readings, whether high or occasionally low, emphasize the need for intervention. This might involve dietary adjustments, changes in physical activity levels, or medication modifications.
- Collaborative Decision Making: While the chart provides valuable data, it's essential to view it as a part of a broader health picture. Collaborating with healthcare professionals ensures that the data is interpreted correctly. They can provide context, offer advice, and recommend necessary changes to treatment or lifestyle.
A High Blood Sugar Levels Chart is more than just numbers on a page. It's a visual representation of one's health, a tool for proactive management, and a guide for making informed decisions about diabetes care.
Research & Evidence
The High Blood Sugar Levels Chart, often called a glucose monitoring chart, has deep roots in the history of diabetes care. Its inception can be traced back to the early days of diabetes research when scientists and medical professionals recognized the need for a systematic approach to monitor blood sugar fluctuations.
- Historical Context: Before the advent of modern glucometers and digital tracking systems, manual charting was the primary method used to monitor blood sugar levels. The chart provided a tangible way for patients to understand their condition and for doctors to make informed treatment decisions.
- Scientific Validation: Over the years, multiple research studies have validated the efficacy of the High Blood Sugar Levels Chart. For instance, a study published in the Journal of Diabetes Science and Technology highlighted that consistent blood sugar monitoring and charting played a pivotal role in improving glycemic control, reducing the risk of diabetes-related complications.
- Patient Empowerment: Another significant advantage of the chart, as noted in research from the American Diabetes Association, is its role in patient empowerment. By actively tracking their blood sugar levels, patients become more engaged in their care, leading to better adherence to treatment plans and improved health outcomes.
- Comprehensive Care: The chart's visual representation has also proven invaluable in multidisciplinary care settings. It allows dietitians, endocrinologists, primary care providers, and other specialists to collaborate more effectively, ensuring comprehensive diabetes care.
- Future Implications: With the rise of digital health technologies, the traditional paper chart is evolving. However, its foundational principle remains unchanged: providing a clear, visual representation of blood sugar levels to guide treatment and improve patient outcomes.
References
American Diabetes Association. (2017). Standards of medical care in diabetes—2017. Diabetes Care, 40(Supplement 1), S11-S24.
Foster, N. C., Miller, K. M., Tamborlane, W. V., Bergenstal, R. M., & Beck, R. W. (2019). Continuous glucose monitoring in patients with type 1 diabetes using insulin injections. Journal of Diabetes Science and Technology, 13(2), 137-143.
Commonly asked questions
Individuals diagnosed with or at risk of diabetes, as well as healthcare professionals managing patients with elevated blood sugar levels.
High Blood Sugar Levels Charts record and track blood sugar readings over time, helping to identify patterns and make informed treatment decisions.
The time varies based on individual needs, but daily entries typically take a few minutes. Regular reviews with healthcare professionals might take longer, depending on the discussions and interventions required.

.jpg)
