
What is an Iceberg Chart Template?
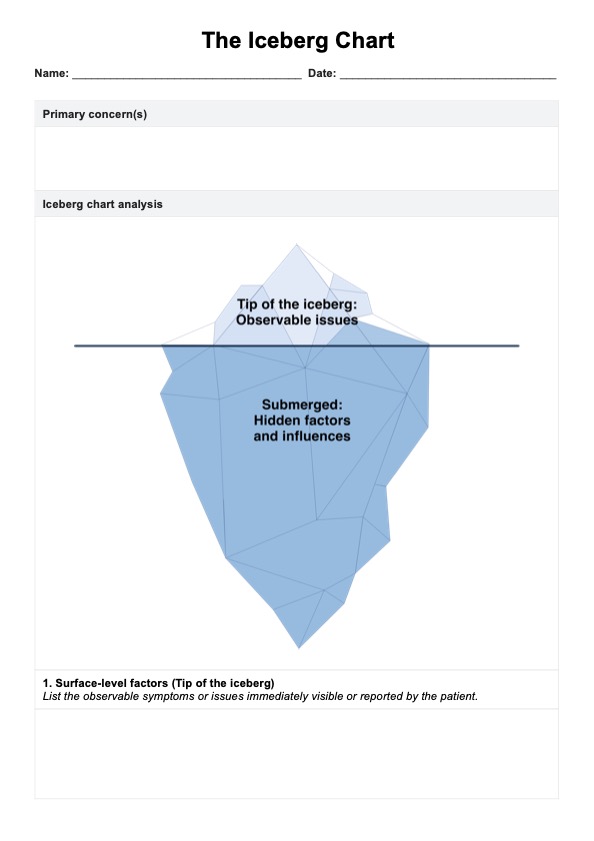
An Iceberg Chart Template is a visual tool healthcare professionals use to analyze complex patient situations by identifying visible and hidden factors influencing health outcomes. This template utilizes the iceberg metaphor, where only a small portion is visible above water, to illustrate that many underlying causes and factors may not be immediately apparent (Mahr, 2022).
The chart typically consists of two main sections: the "tip of the iceberg," representing observable symptoms or events, and the larger "underwater" portion, depicting deeper, less obvious factors contributing to the patient's condition.
Iceberg templates can be used to comprehensively understand patient cases, promote awareness of underlying issues, and develop more effective treatment strategies. The diagram encourages looking beyond surface-level presentations and exploring deeper factors such as social determinants of health, psychological influences, and environmental conditions.
By using iceberg diagrams, practitioners can identify complex interrelationships between various factors, share ideas with their community of practice, and generate more holistic approaches to difficult health challenges. This way of organizing information facilitates a deeper analysis of patient situations, potentially leading to more effective interventions and positive changes in health outcomes.


