प्राथमिक देखभाल चिकित्सक, रुमेटोलॉजिस्ट, और अन्य विशेषज्ञ सूजन से संबंधित स्थितियों का निदान करने में मदद करने के लिए ईएसआर परीक्षण का अनुरोध कर सकते हैं।
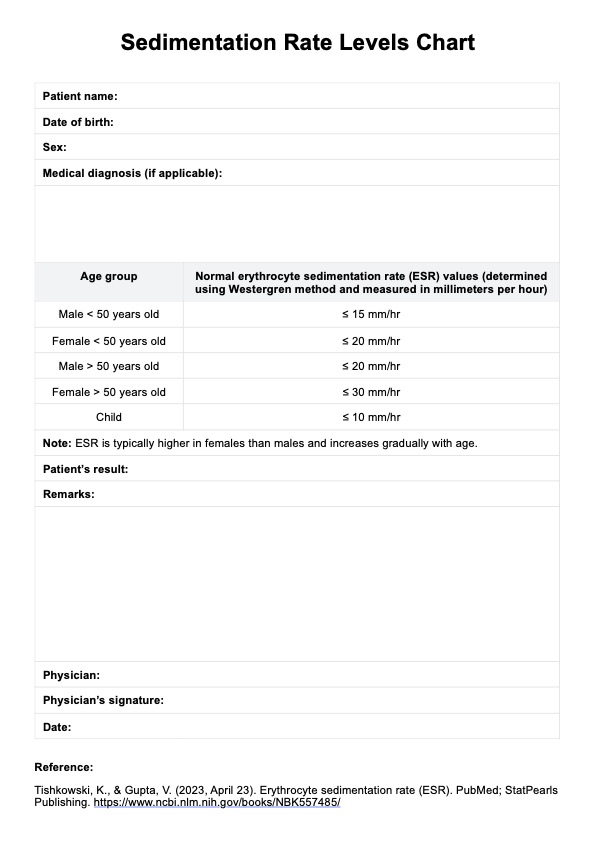
अवसादन दर स्तर चार्ट
सूजन संकेतकों के लिए ESR परीक्षण के परिणामों को ट्रैक करने और रोगी की देखभाल को प्रभावी ढंग से प्रबंधित करने के लिए एक मुफ्त अवसादन दर स्तर चार्ट डाउनलोड करें।

Use Template
अवसादन दर स्तर चार्ट Template
Commonly asked questions
सेडिमेंटेशन रेट लेवल चार्ट का उपयोग तब किया जाता है जब लक्षण गठिया, वास्कुलिटिस, या सूजन आंत्र रोग जैसी स्थितियों का सुझाव देते हैं और इन स्थितियों की गतिविधि की निगरानी करने के लिए उपयोग किया जाता है।
सूजन की उपस्थिति और गंभीरता का आकलन करने के लिए सामान्य श्रेणियों के साथ ईएसआर परिणामों को रिकॉर्ड करने और तुलना करने के लिए अवसादन दर स्तर चार्ट का उपयोग किया जाता है।
EHR and practice management software
Get started for free
*No credit card required
Free
$0/usd
Unlimited clients
Telehealth
1GB of storage
Client portal text
Automated billing and online payments