Perceived Stress Scale

Use the Perceived Stress Scale to assess your patient's level of stress. You can download a free printable Perceived Stress Scale PDF here.

By RJ Gumban on Jul 02, 2024.

tick

Fact Checked by Nate Lacson.

Use Template
Perceived Stress Scale PDF Example
toolsShare uiAI icon

How can you measure perceived stress?

Perceived stress involves the feelings or thoughts an individual experiences in response to the demands or pressures of a situation, known as stressors (Cohen et al., 1983). In a nutshell, perceived stress reflects how an individual evaluates and copes with the stressors in their life.

Perceived stress can vary widely from person to person, even in response to the same stressor. For example, some individuals may perceive a demanding work deadline as highly stressful, while others may view it as a challenge and an opportunity for growth.

Measuring perceived stress is crucial for understanding an individual's subjective experience of stress and its potential impact on their health and well-being. One of the most widely used and validated tools for assessing perceived stress is the Perceived Stress Scale (PSS), developed by Cohen and colleagues (1983).

Printable Perceived Stress Scale

Download this Perceived Stress Scale in order to effectively assess levels of stress.

What is the Perceived Stress Scale (PSS?)

The PSS is a self-reported questionnaire that assesses an individual's perception of stress levels over the past month. It is a global measure of stress, meaning it does not focus on specific sources of stress but rather on the degree to which life situations are appraised as stressful (Lee, 2012).

The PSS is available in three versions: the original 14-item scale (PSS-14), a 10-item version (PSS-10), and a 4-item version (PSS-4). The most commonly used is the PSS-10, which consists of six negative items and four positive items and was developed using factor analysis-based data.

The PSS-10 has been widely studied and validated across various populations and community samples. Factor analysis studies have generally supported a one-factor or two-factor structure, with the two factors representing perceived helplessness and perceived self-efficacy (Cohen & Williamson, 1988; Roberti et al., 2006).

Psychometric evidence

The PSS boasts strong psychometric evidence, making it a reliable and valid tool for measuring psychological stress in a probability sample, including pregnant and postpartum women, college students, and cardiac patients.

The PSS-10 has shown good internal consistency reliability, with Cronbach's alpha ranging from 0.75 to 0.86 in different studies (Cohen, 1988; Roberti et al., 2006; Wongpakaran & Wongpakaran, 2010). Test-retest reliability over two days to two weeks has also been reported as adequate, with correlations ranging from 0.55 to 0.85 (Cohen et al., 1983; Roberti et al., 2006).

The PSS has also demonstrated good construct validity, with higher scores being associated with higher levels of depression, anxiety, and risk of contracting an infectious disease. Additionally, the PSS has been positively correlated with other measures of stress, such as the Beck Depression Inventory (BDI), the Hospital Anxiety and Depression Scale, the Edinburgh Postnatal Depression Scale, and the State-Trait Anxiety Inventory (STAI), and the Thai Depression Inventory (Wongpakaran & Wongpakaran, 2010; Andreou et al., 2011; Baik et al., 2019).

This was further supplemented by the correlation with the  Center for Epidemiologic Studies Depression Scale having statistically significant correlation coefficients with the PSS (Cristóbal-Narváez et al., 2021).

Confirmatory factor analysis studies have generally supported the one-factor structure or the two-factor model of the PSS-10, providing evidence for its construct validity (Roberti et al., 2006; Wongpakaran & Wongpakaran, 2010).

While the Cohen Perceived Stress Scale is a valuable tool, it should not be used as a diagnostic instrument on its own. It's important to consider other measures alongside it for a comprehensive psychometric evaluation and data analysis. Here are some additional options to tap into the different aspects of emotional and psychological stress:

  • Depression Anxiety Stress Scale (DASS-21): This is a 21-item scale measuring depression, anxiety, and stress severity.
  • General Health Questionnaire (GHQ-12): This is a 12-item scale assessing mental health status in the general population.
  • Beck Depression Inventory (BDI-II): This is a 21-item scale specifically designed to measure the severity of depression.

How do you use this Perceived Stress Scale (PSS)?

Using the Perceived Stress Scale (PSS) can provide valuable insights into an individual's subjective experience of stress. Here's a step-by-step guide on how to administer and interpret the PSS:

Step 1: Administer the PSS

The PSS consists of 10 items that assess an individual's perception of stress over the past month. Participants rate each item on a scale from 0 (never) to 4 (very often). The questionnaire can be self-administered or administered verbally.

Step 2: Calculate the PSS score

First, reverse the scores for the positively stated items (items 4, 5, 7, and 8) to calculate the PSS score. Then, sum up the scores for all 10 items. Higher scores indicate higher levels of perceived stress.

Step 3: Interpret the PSS score

The PSS has no definitive cut-off score for high or low-stress levels. However, researchers have provided normative data based on various populations.

Step 4: Consider individual factors

When interpreting the PSS score, it's essential to consider individual factors such as age, gender, and cultural background. Additionally, the PSS should be used with other assessments and clinical information to understand the individual's stress experience and coping strategies comprehensively.

Step 5: Use in treatment planning and monitoring

The PSS can be useful for healthcare practitioners to identify individuals who may benefit from stress management interventions. It can also be administered periodically to monitor changes in perceived stress levels due to treatment or life circumstances.

Perceived Stress Scale example (sample)

We have included a sample template to help healthcare providers better understand the types of questions asked and how to respond to them. It is important to note that this is only an example, and individuals may react differently to the questions based on their own experiences and circumstances. 

The sample template is available in PDF and printable formats, making it accessible and straightforward for anyone interested in assessing their perceived stress levels.

Download this Perceived Stress Scale example (sample) here:

Perceived Stress Scale example (sample)

Scoring and interpretation

Accurately interpreting the results of the Perceived Stress Scale is crucial for understanding an individual's subjective experience of stress and developing appropriate coping strategies.

To score the PSS, first, reverse the scores for the positively stated items (items 4, 5, 7, and 8). For example, if a participant scores a 4 on item 4, it should be coded as 0. Then, sum up the scores for all 10 items to get the total PSS score.

The total PSS score can range from 0 to 40, with higher scores indicating higher levels of perceived stress. Scores ranging from 0 to 13 are considered low stress, 14 to 26 are regarded as moderate stress, and 27 to 40 are considered high perceived stress.

Additionally, the PSS should be used with other assessments and clinical information to comprehensively understand the individual's stress experience and coping strategies. It's not recommended to rely solely on the PSS score for diagnostic or treatment purposes.

Why use Carepatron as your Perceived Stress Scale software?

Choosing Carepatron as your Perceived Stress Scale software can streamline the process of measuring and managing stress levels among patients. One of the main benefits of utilizing Carepatron for the PSS is its comprehensive solution. Carepatron not only offers tools for administering and scoring the PSS but also integrates these tools with additional resources, such as our clinical documentation software.

Carepatron is also designed to accommodate the needs of healthcare practitioners by offering seamless and integrated practice management software. With this software, you can schedule appointments, process billing, and set up an online patient portal.

Using Carepatron to administer the Perceived Stress Scale transforms how you deliver care. Ready to experience this for your practice? Sign up for a free trial today!

Practice Management Software

References

Andreou, E., Alexopoulos, E. C., Lionis, C., Varvogli, L., Gnardellis, C., Chrousos, G. P., & Darviri, C. (2011). Perceived Stress Scale: reliability and validity study in Greece. International Journal of Environmental Research and Public Health, 8(8), 3287–3298. https://doi.org/10.3390/ijerph8083287

Baik, S. H., Fox, R. S., Mills, S. D., Roesch, S. C., Sadler, G. R., Klonoff, E. A., & Malcarne, V. L. (2019). Reliability and validity of the Perceived Stress Scale-10 in Hispanic Americans with English or Spanish language preference. Journal of Health Psychology, 24(5), 628–639. https://doi.org/10.1177/1359105316684938

Cohen, S., Kamarck, T., & Mermelstein, R. (1983). A global measure of perceived stress. Journal of Health and Social Behavior, 24(4), 385–396. https://doi.org/10.2307/2136404

Cohen, S. (1988). Perceived stress in a probability sample of the United States. In S. Spacapan & S. Oskamp (Eds.), The social psychology of health (pp. 31–67). Sage Publications, Inc.

Cohen, S., & Janicki-Deverts, D. (2012). Who's stressed? Distributions of psychological stress in the United States in probability samples from 1983, 2006, and 2009. Journal of Applied Social Psychology, 42(6), 1320–1334. https://doi.org/10.1111/j.1559-1816.2012.00900.x

Cristóbal-Narváez, P., Haro, J. M., & Koyanagi, A. (2021). Longitudinal association between perceived stress and depression among community-dwelling older adults: Findings from the Irish Longitudinal Study on Ageing. Journal of Affective Disorders, 299. https://doi.org/10.1016/j.jad.2021.12.041

Lee, E. H. (2012). Review of the psychometric evidence of the Perceived Stress Scale. Asian Nursing Research, 6(4), 121–127. https://doi.org/10.1016/j.anr.2012.08.00

Roberti, J. W., Harrington, L. N., & Storch, E. A. (2006). Further psychometric support for the 10-item version of the Perceived Stress Scale. Journal of College Counseling, 9(2), 135–147. https://doi.org/10.1002/j.2161-1882.2006.tb00100.x

Wongpakaran, N., & Wongpakaran, T. (2010). The Thai version of the PSS-10: An investigation of its psychometric properties. Biopsychosocial Medicine, 4, 6. https://doi.org/10.1186/1751-0759-4-6

What is the Perceived Stress Scale-10 (PSS-10) item scale?

Commonly asked questions

What is the Perceived Stress Scale-10 (PSS-10) item scale?

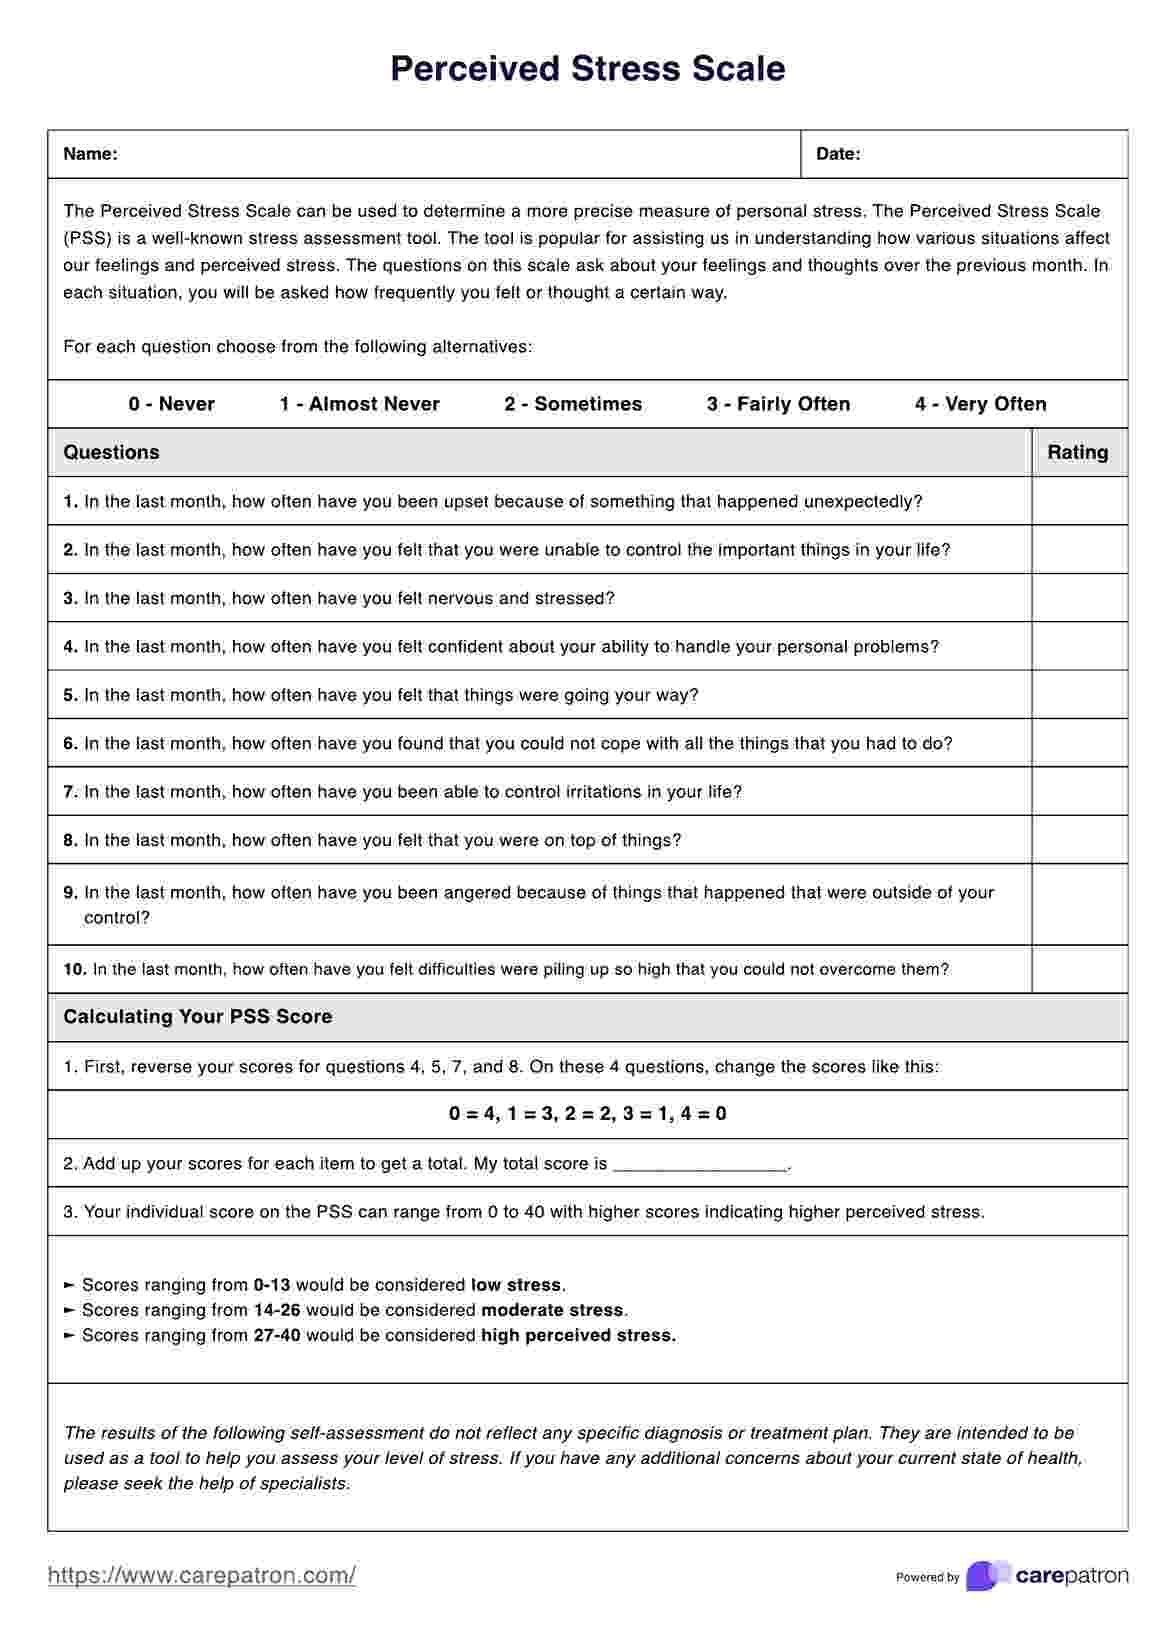
The Perceived Stress Scale (PSS) is a 10-item questionnaire designed to evaluate self-reported stress levels by assessing thoughts and feelings related to stress experienced over the past month. The PSS-10 measures the degree to which situations in one's life are appraised as stressful, unpredictable, uncontrollable, and overloading.

What does a high score on a Perceived Stress Scale mean?

A high score on the Perceived Stress Scale indicates higher levels of perceived stress. Scores ranging from 27 to 40 are considered high perceived stress, while scores from 14 to 26 are regarded as moderate stress, and scores from 0 to 13 are considered low stress. Higher scores are associated with physical illness, less sleep, unhealthy behaviors, and other negative outcomes.

How do you score the Perceived Stress Scale?

To score the Perceived Stress Scale, the responses to the 10 items are summed, with positively stated items (items 4, 5, 7, and 8) reverse scored. The potential total scores range from 0 to 40, with higher scores indicating higher levels of perceived stress. The scoring is based on a 5-point Likert scale ranging from 0 (never) to 4 (fairly often).

Join 10,000+ teams using Carepatron to be more productive

One app for all your healthcare work