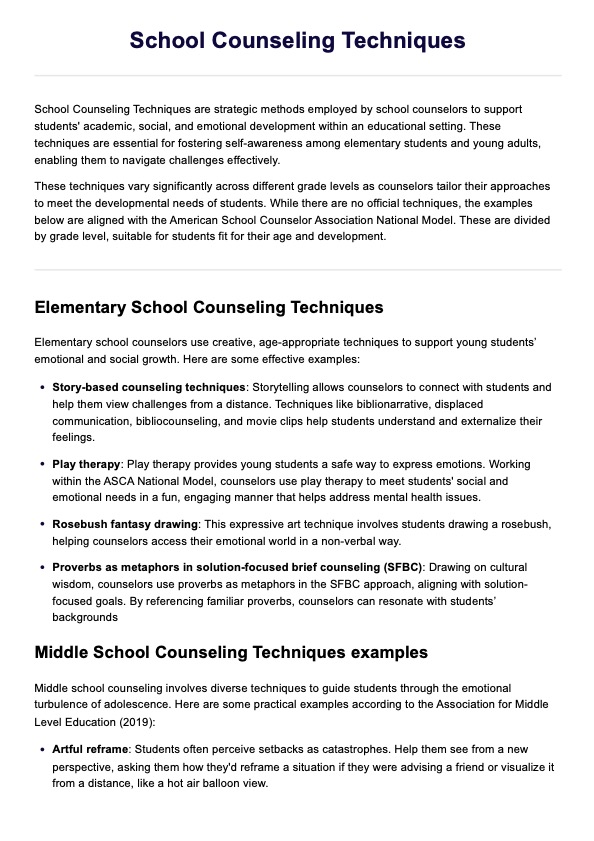
Genogram Symbols Sheet
Genogram Symbols are useful tools to understand the pattern of generations of a family. Download this sheet to help you also understand patterns of behavior and relationships.

Fact Checked by RJ Gumban.


What is a genogram?
Have you ever stared at a genogram with symbols and lines, unsure of what they all mean? Genograms, while powerful tools for understanding family dynamics, can appear like the cryptic language you must decode at first glance. Unlike family trees that list names and birth years, genograms go much more in-depth, using symbols and lines to show biological or legal connections and emotional and relational ties.
Healthcare practitioners familiar with genograms find that genograms will help them in more ways than one. Here are some of the reasons why genograms are useful:
- Risk assessment: Practitioners can measure an individual's susceptibility to certain illnesses by precisely notating hereditary conditions. This reduces the risk of oversight and sharpens the focus on preventive measures.
- Patient dialogue: Discussing family history can be sensitive. A genogram facilitates these conversations by offering an organized and sensitive approach to discussing familial patterns without overwhelming the patient.
- Multidisciplinary coordination: When multiple professionals are involved in care, a genogram ensures that everyone understands the patient's background.
- Mental health insights: Marking the nature of relationships and noting any psychological disorders helps practitioners gain deeper insight into the patient's mental and emotional environment, which can inform therapeutic approaches.
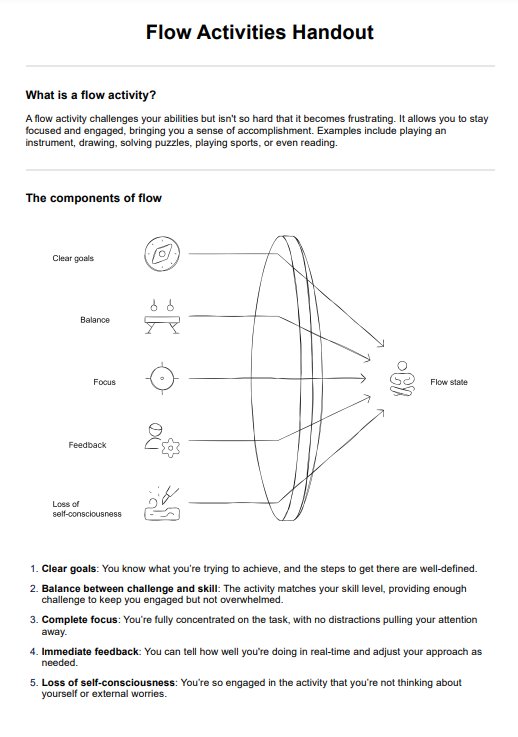
Key components of a genogram
A genogram consists of the following components:
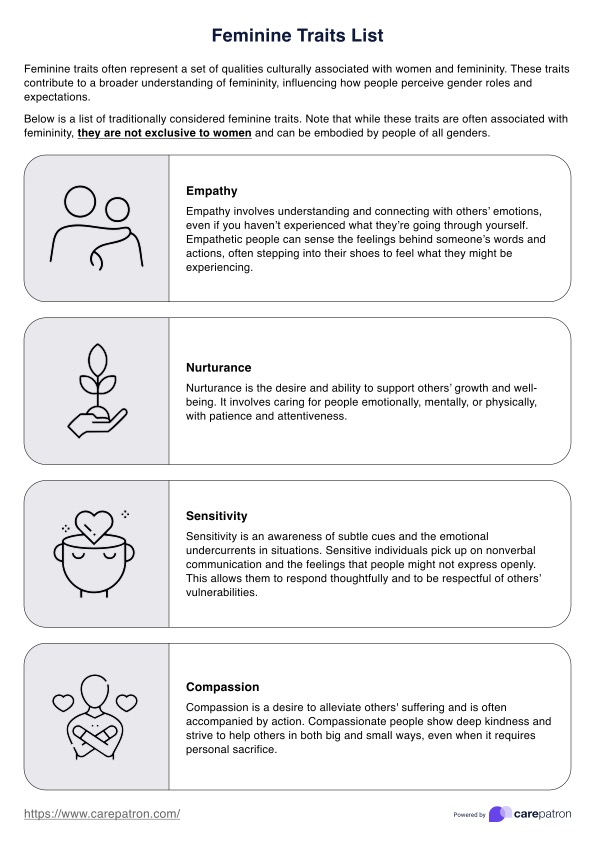
- Symbols: Genogram symbols are straightforward yet informative. Typically, males are represented by squares and females by circles. Other symbols might represent non-binary or transgender individuals, reflecting modern inclusiveness in medical and social research.
- Lines and connections: The connections between individuals are shown using various lines. Solid lines might represent biological or marital connections, while dashed lines could indicate foster relationships or adoptions. Additionally, emotional relationships are annotated with specific lines, such as a zigzag line, to depict a strained or volatile relationship.
- Health and psychological data: Perhaps most crucial for healthcare settings, genograms can illustrate medical histories, hereditary traits, psychological factors, and even lifestyle choices like smoking or alcohol consumption. This is typically done using color coding or adding specific icons following an individual, such as a heart for heart disease or a wheelchair symbol for disabilities.
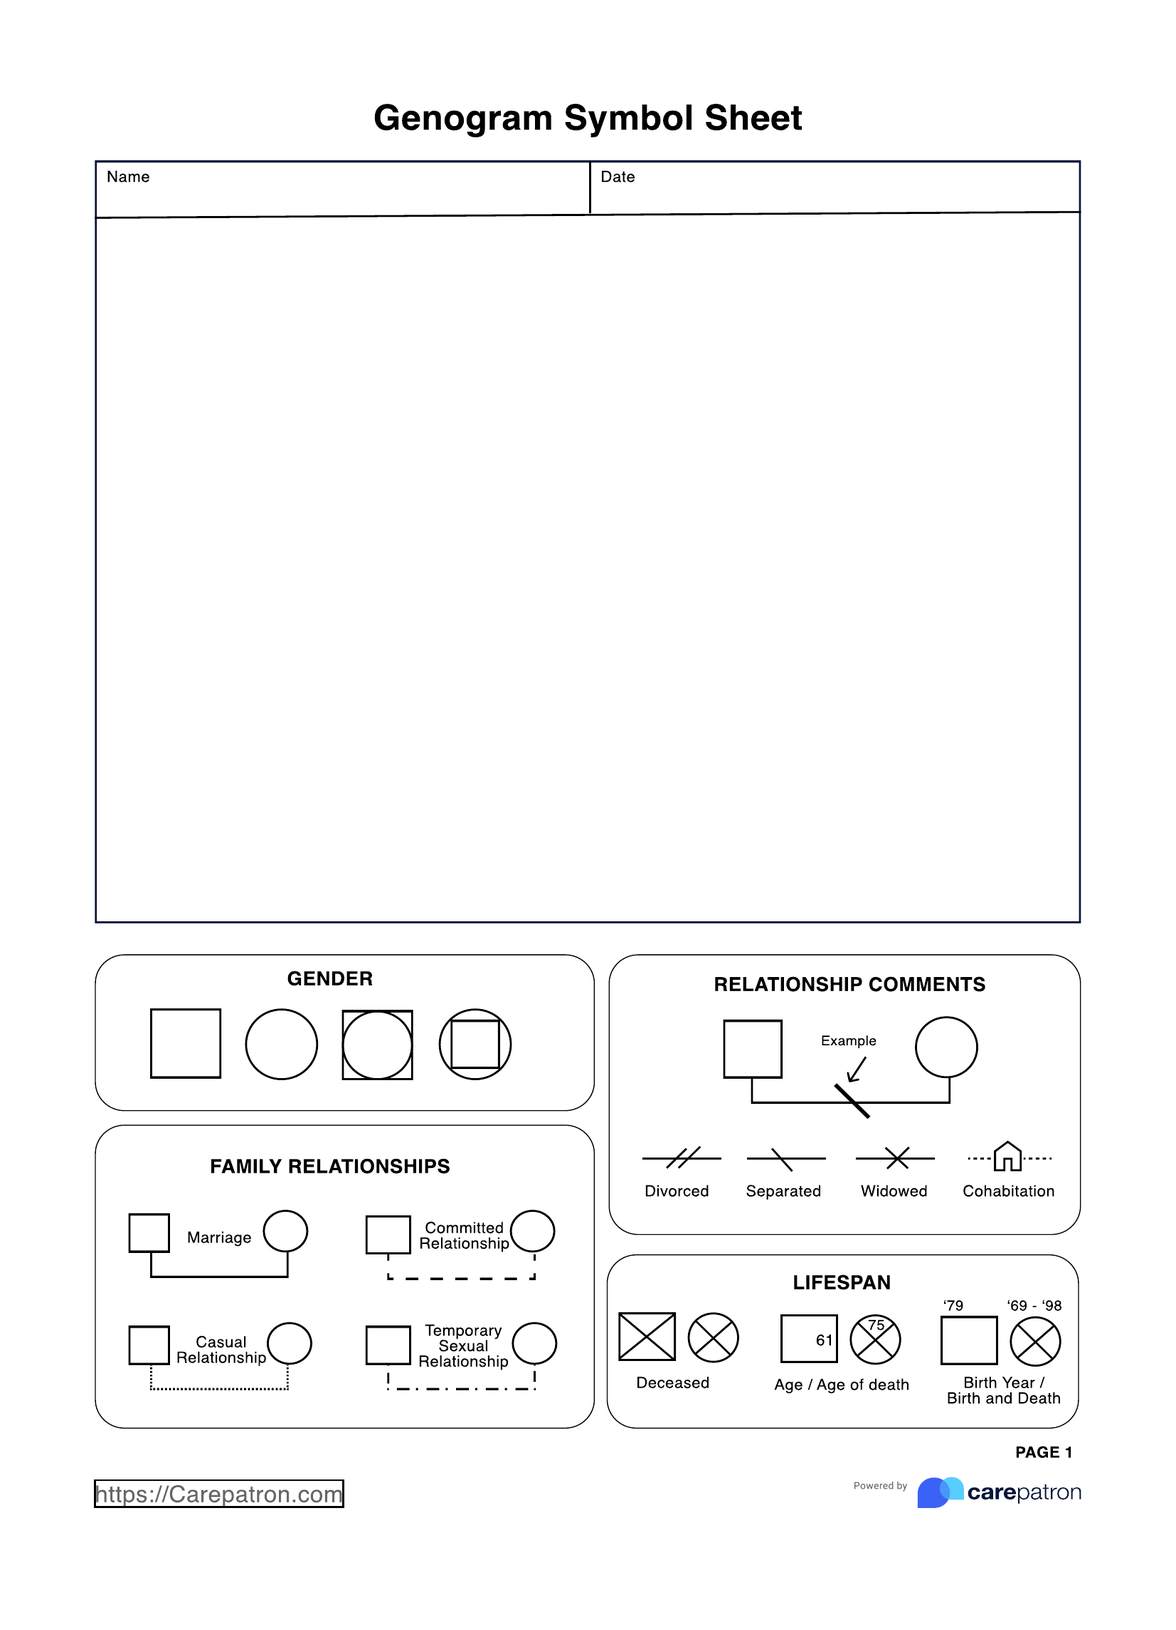
Genogram Symbols Sheet Template
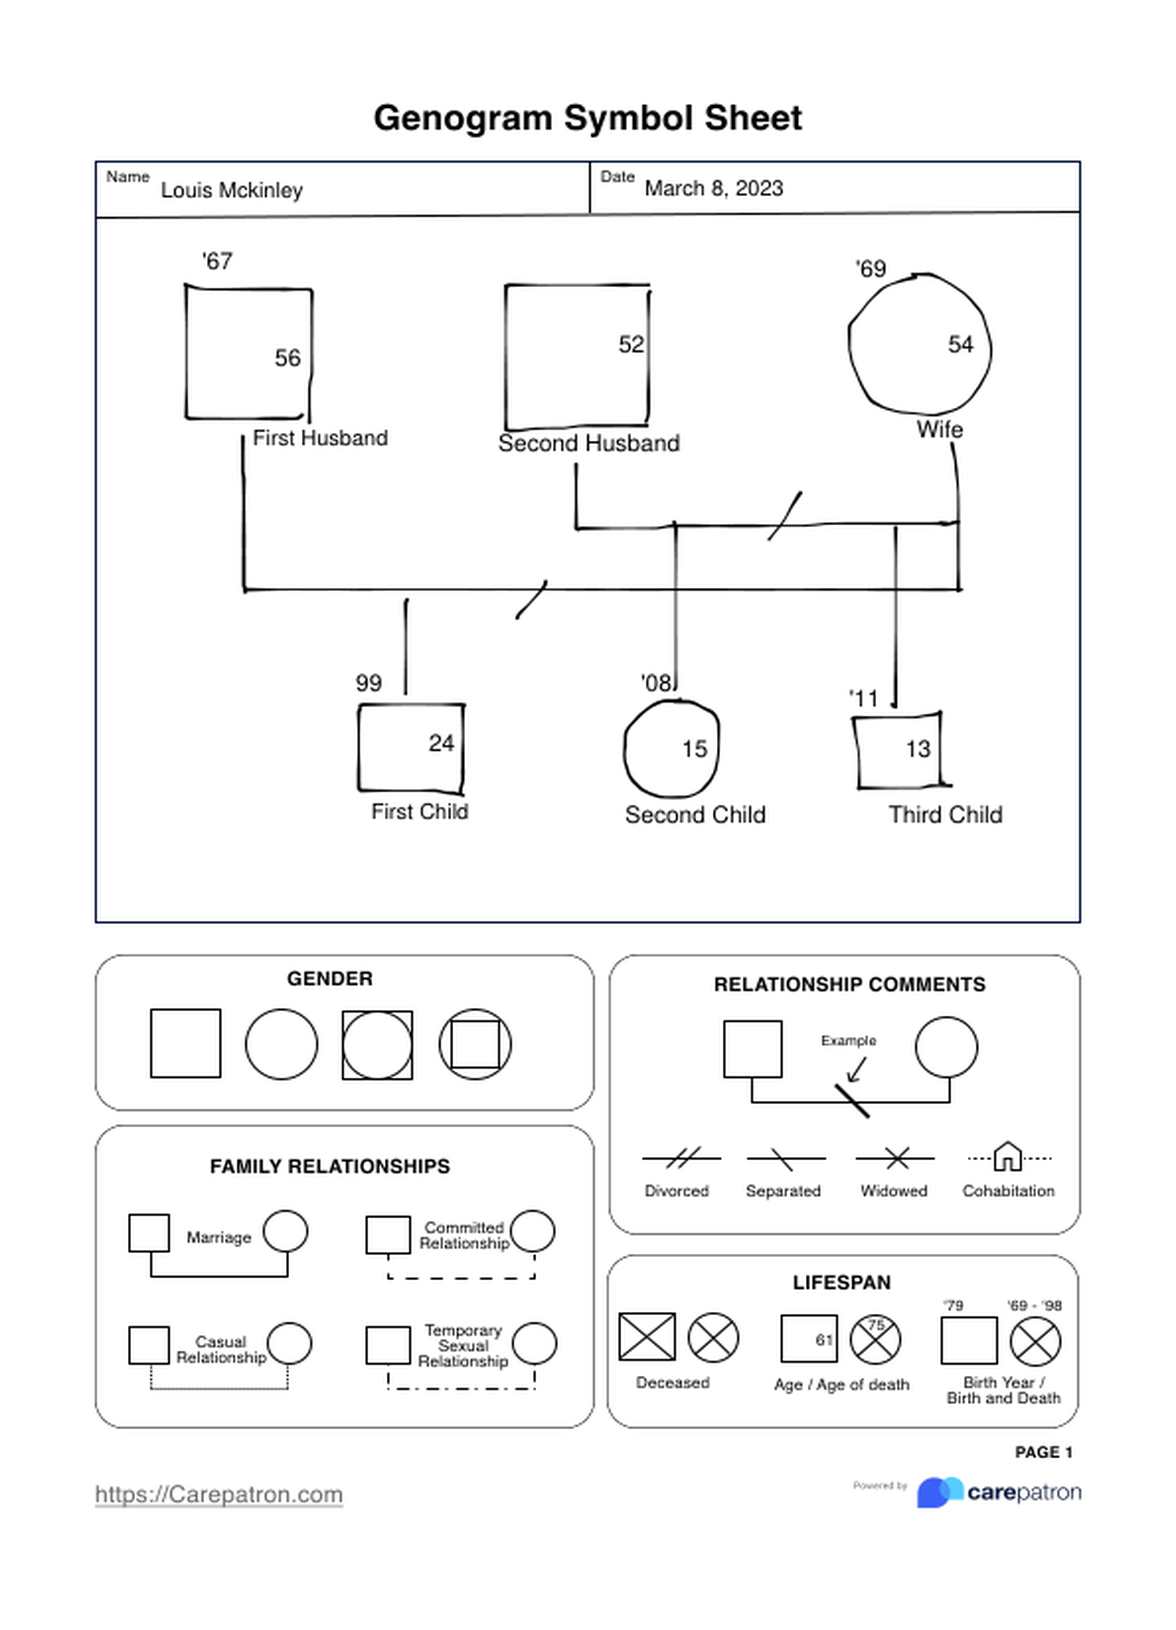
Genogram Symbols Sheet Example
Types of genograms
Genograms are visual tools that help us understand family relationship dynamics, and they come in different types. The most common types of genograms include:
3 Generation Genogram
A 3 Generation Genogram is a family genogram example and type that visually represents family links, dynamics, and vital information covering at least three generations, including extended members like aunts, uncles, and cousins. Healthcare professionals usually utilize a family genogram template, specifically a 3 Generation Genogram Template, to gain insights into a person's family dynamics, identify potential risk factors, and understand intergenerational influences on their well-being.
Medical genograms
This type is highly popular and focuses on tracking diseases and medical conditions within a family. By illustrating patterns of illness, medical genograms help understand hereditary health issues and predict potential health risks using the family's medical history, which can be crucial for preventative healthcare planning.
Social genograms
Social genograms delve into the intricacies of relationships and histories within a family. They focus on aspects such as mental health, physical health, and substance abuse histories, offering a comprehensive view of the social and emotional dynamics at play. These genograms are useful in therapeutic and counseling settings to address and understand complex familial interactions and histories.
What is a Genogram Symbol Sheet?
A genogram uses standardized symbols and notations to depict various aspects of a family system, including family members, relationships, significant life events, and potential areas of concern or strength.
The family generation Genogram symbol sheet then includes a range of symbols and their meaning, each representing a specific aspect of an individual or family unit. Common symbols may consist of squares for males, circles for females, horizontal lines for marital or romantic relationships, diagonal lines for children, and various additional markings to indicate occurrences such as divorces, separations, miscarriages, or adoptions. These can then be linked to connect different generations, for instance, into a three-family generation genogram.
With this editable genogram template, you can:
- Identify family members: Standardized symbols differentiate between males (squares) and females (circles), making it easy to navigate the family tree.
- Understand relationship dynamics: Solid, dashed, and dotted lines depict the nature of the relationships – close, distant, conflicted, or even broken.
- Gain insight into family history: Symbols can represent significant events like death, marriages, separations, births, miscarriages, and even health issues as specific as colon cancer, heart disease, diabetes, asthma, and other hereditary medical conditions.
How to use this Genogram Symbols Sheet
A comprehensive genogram symbols sheet can be an invaluable resource for healthcare practitioners working with genograms. Here's a step-by-step guide on how to effectively use our Genogram Symbols Sheet:
Step 1: Understand critical symbols
Start by learning the standard symbols used in genograms, such as squares for males, circles for females, and lines to represent relationships and family dynamics, including marriages, divorces, and adoptions.
Step 2: Collect family information
Before drafting the genogram, compile crucial information about your client's family. This includes names, birthdates, significant life events, and known health issues.
Step 3: Map out client and immediate family
Place the client at the center of your genogram and add direct family members—parents, siblings, spouses, and children. Use lines to show their relationships to the client.
Step 4: Include extended family members
Broaden the genogram by adding grandparents, aunts, uncles, cousins, or other relatives. Consistent use of symbols and lines helps in depicting accurate family relationships.
Step 5: Incorporate information and analyze
Apply symbols to indicate health conditions, psychological issues, or other relevant details. Once the genogram is complete, analyze it to identify patterns, risk factors, and strengths within the family structure. Use this analysis to guide discussions and planning in your client's care.
Why is this form useful for mental health practitioners?
Understanding a client's family history is crucial in the mental health industry. This is where genograms come in – offering a unique and powerful lens for mental health practitioners. Here are some reasons why genograms are a must-have in your therapeutic toolkit:
- Visualizing family dynamics: Genograms clearly show relationships within families over multiple generations, highlighting closeness, conflict, and even patterns of communication across generations. This visual representation can spark meaningful conversations and uncover hidden dynamics that might influence a person's mental health.
- Identifying patterns of behavior: The genogram allows you to spot recurring themes or behaviors within a family. This could involve issues like anxiety, depression, or even substance abuse. Recognizing these patterns can provide valuable clues for treatment planning and breaking unhealthy cycles.
- Understanding family triggers: Family history can be vital to understanding a client's struggles. A genogram can reveal past experiences of trauma, loss, or dysfunctional relationships that might be contributing to present-day mental health challenges. This can also extend to relationships with significant friends and other parts of the social network.
- Promoting open communication: Creating a genogram can be a collaborative effort between you and your client. Discussing family history can help maintain trust and openness, paving the way for deeper exploration of underlying issues.
Commonly asked questions
In genograms, males are represented by squares, and circles represent females. This standard symbolization helps identify gender at a glance, which is essential for tracking hereditary patterns.
Yes, genograms can include significant social relationships, such as close friends, mentors, or anyone who significantly impacts an individual’s life. These connections are usually marked differently to distinguish them from biological and marital relationships.
Absolutely. Genograms can illustrate various medical and psychological conditions through specific symbols or abbreviations next to the individual. This feature is crucial for understanding hereditary illnesses or family behavior patterns.
Related Templates

Popular Templates

-template.jpg)